SysTrack
SysTrack by Lakeside Software is a digital employee experience (DEX) platform that monitors endpoint health and performance. Integrating SysTrack with Yellow.ai lets your AI agent diagnose device issues, look up inventory and users, and run remediation automations during a conversation, without the user having to raise a ticket.
What you can do with this integration:
- Diagnose a device: Check health scores, CPU, memory, disk, network latency, uptime and recent application crashes for a user's machine.
- Fix issues automatically: Run a SysTrack automation (such as clearing the DNS cache or cleaning the disk) and check whether it succeeded.
- Look up inventory and users: Find the systems a user signs in to, installed packages and their sizes, and hardware or software inventory.
- Work at group level: List groups and get the systems, users, inventory and device health for a whole group.
- Engage employees: List and run SysTrack engagements, and read survey questions and results.
Before you begin
Collect these two values from your SysTrack administrator:
| Value | Description |
|---|---|
| API Base URL | The base URL of your SysTrack API, for example https://your-tenant.lakesidesoftware.com. Do not add /api or a trailing slash. |
| API Token | A SysTrack API key. It is sent in the systrack-api-key header on every request. |
The API key needs read access to systems, groups, sensors, inventory, surveys and engagements. It also needs write access if you want to use Run automation or Run engagement.
Connect SysTrack with Yellow.ai
In a two-tier environment, connect the integration in the Development environment. In a three-tier environment, connect it in Staging or Sandbox. Connected integrations are available in the live environment.
-
Switch to the Development/Staging environment.
-
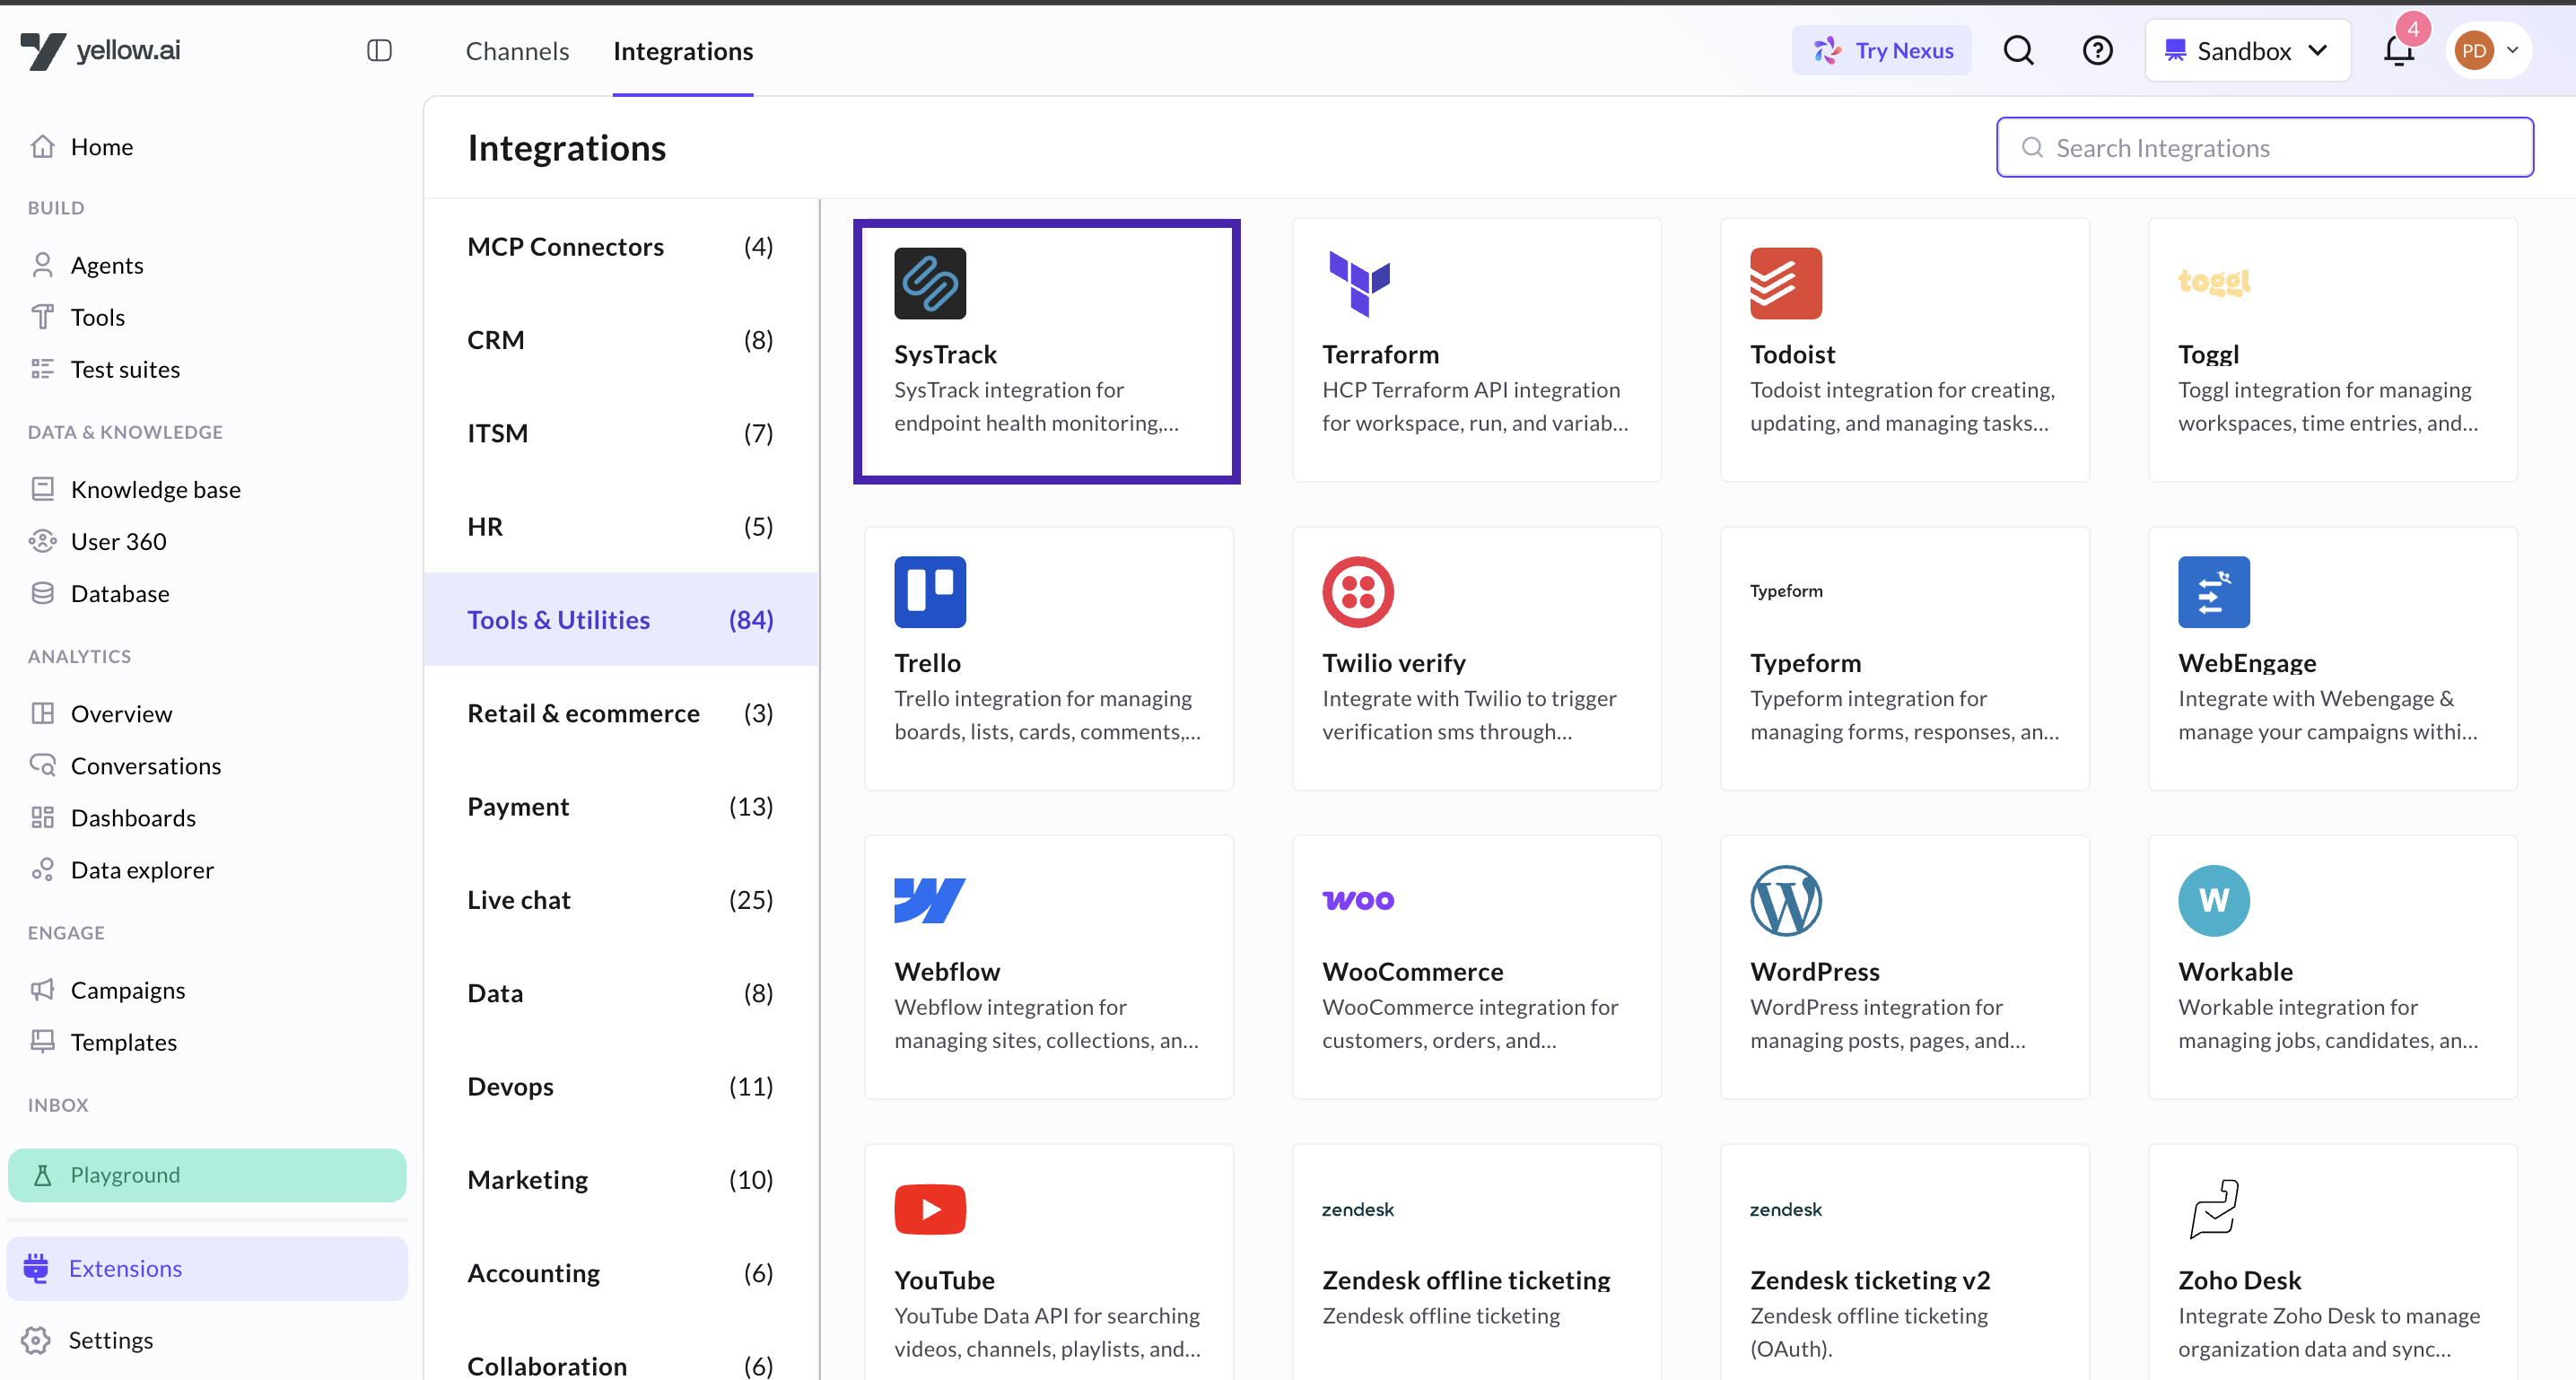
Go to Extensions > Integrations > Tools & Utilities > SysTrack. You can also search for SysTrack in the Search box.
-
Fill in the account details:
Field Description Give account name A name for this SysTrack account. Only lowercase letters, numbers and _are supported.API Base URL Your SysTrack API base URL, for example https://your-tenant.lakesidesoftware.com.API Token Your SysTrack API key. -
Click Connect. Yellow.ai checks the credentials by calling
GET /api/groups. If the URL or token is wrong, the connection fails with an error. -
To add another account, repeat these steps.
When you have more than one account, select the right account in each node.
Use SysTrack actions in a flow
-
Open the flow where you want the AI agent to use SysTrack.
-
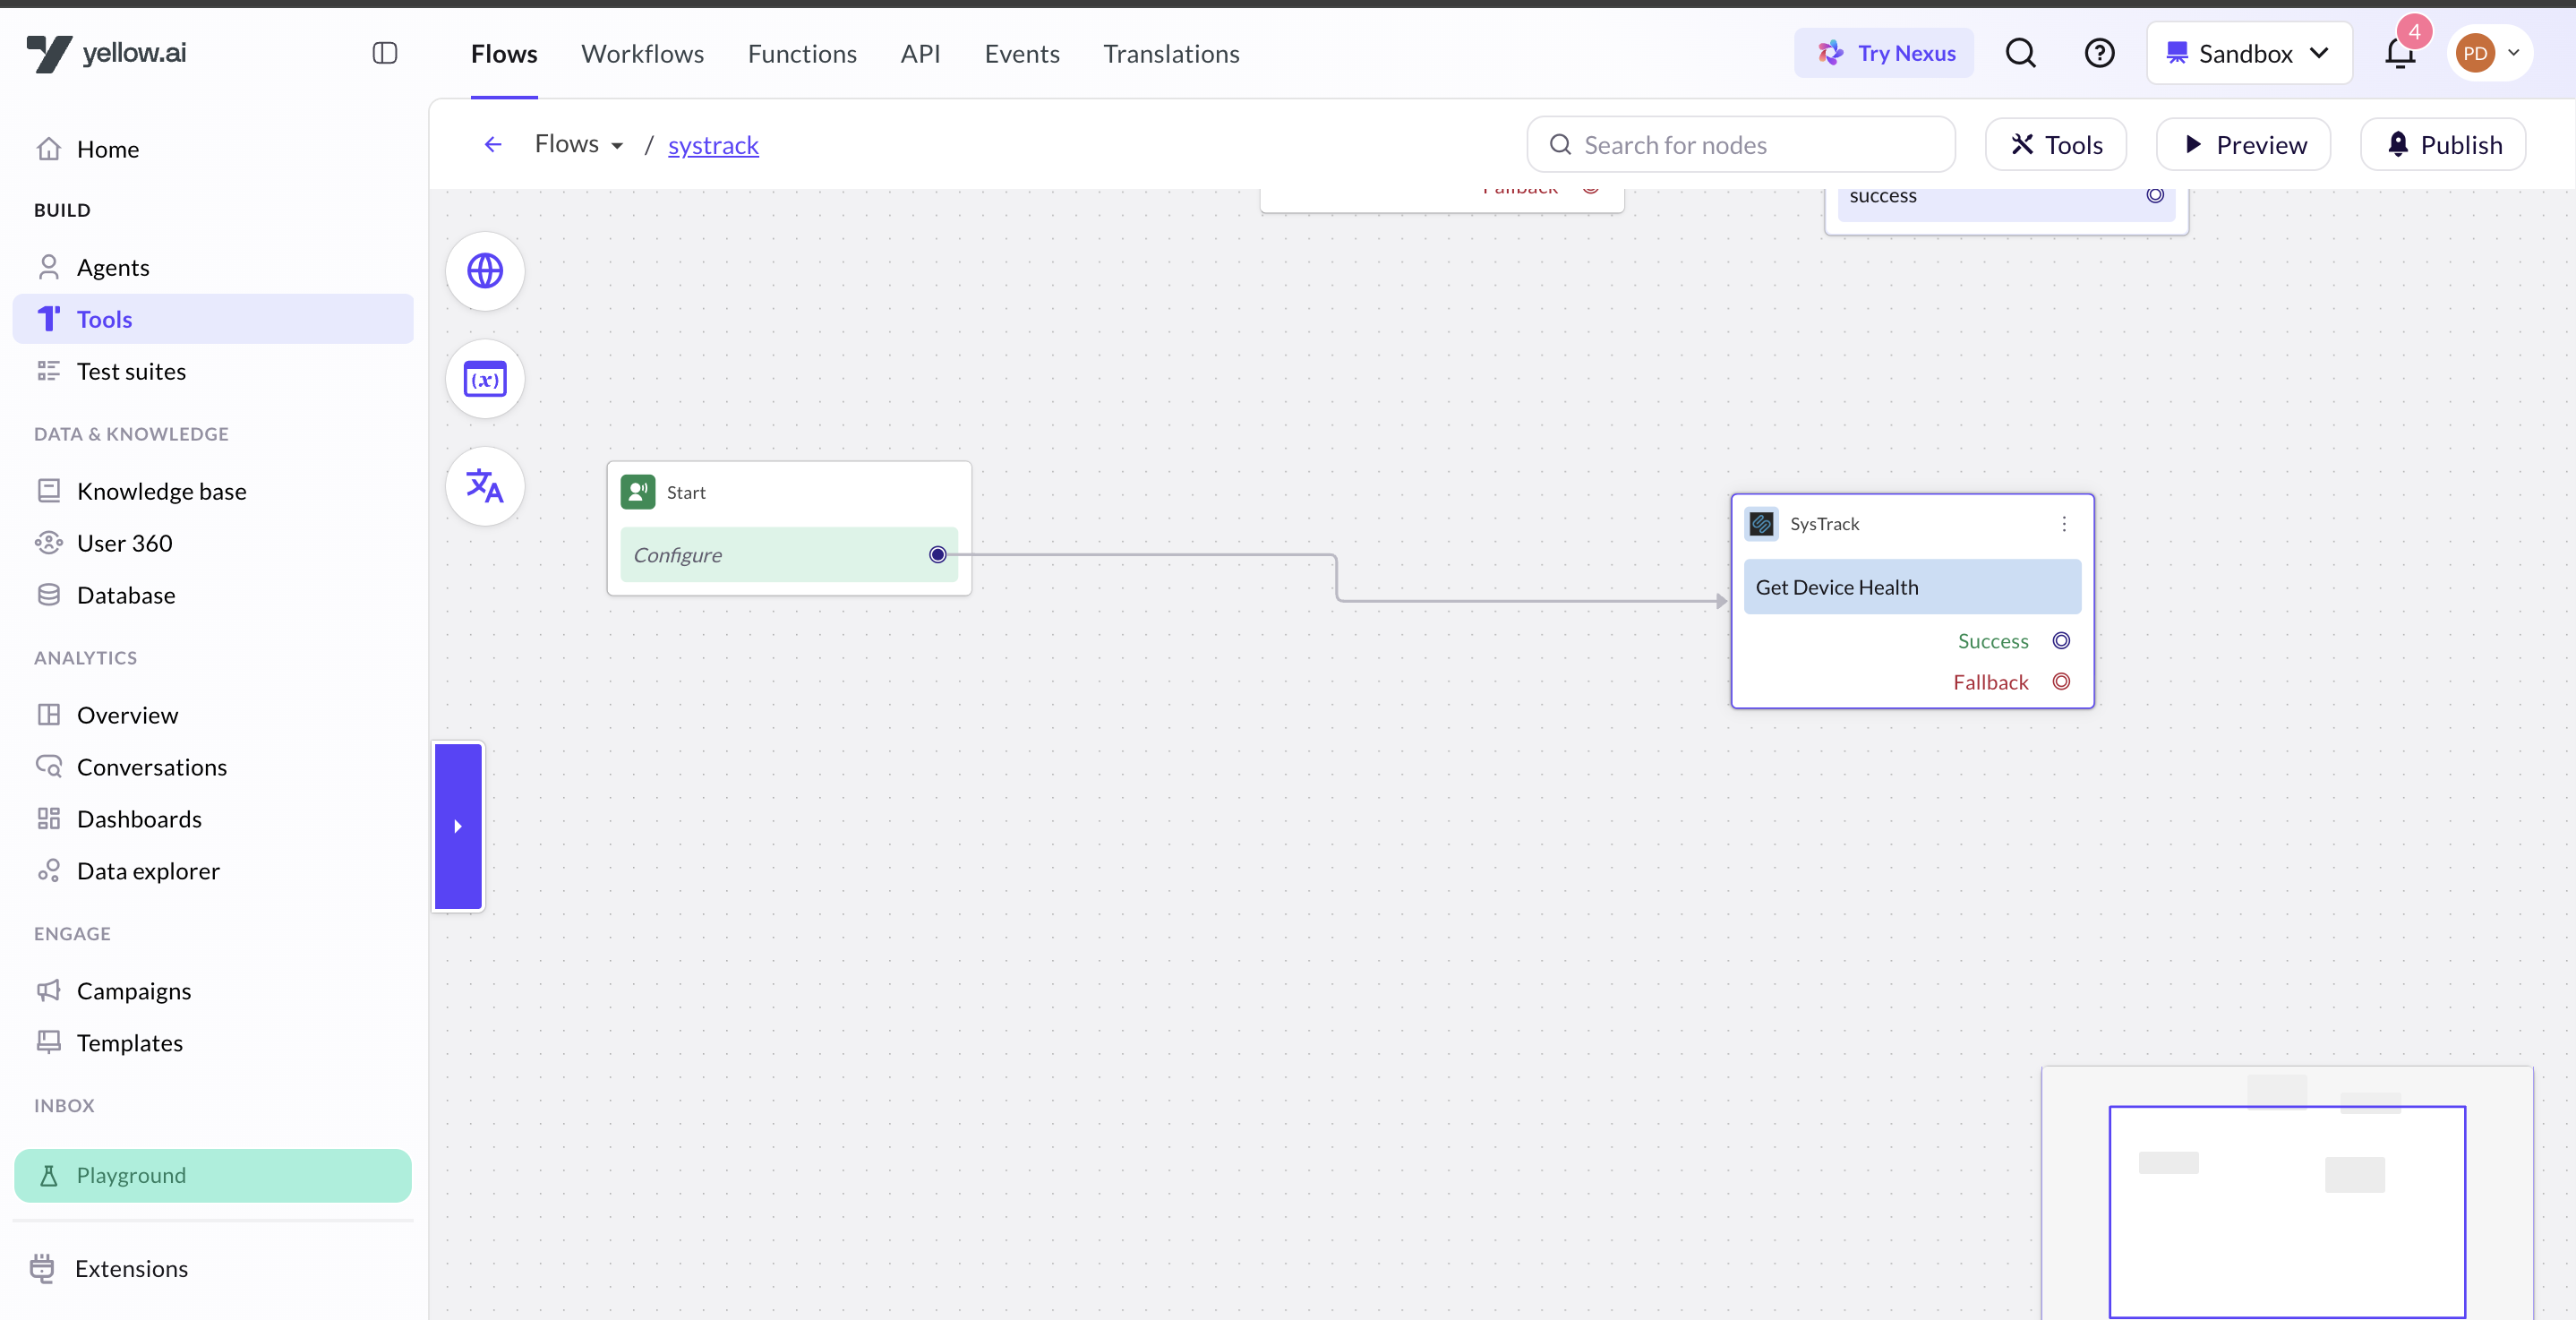
Drag the node connector and go to Integrations > SysTrack. The SysTrack node is added to the flow, with Success and Fallback paths.
-
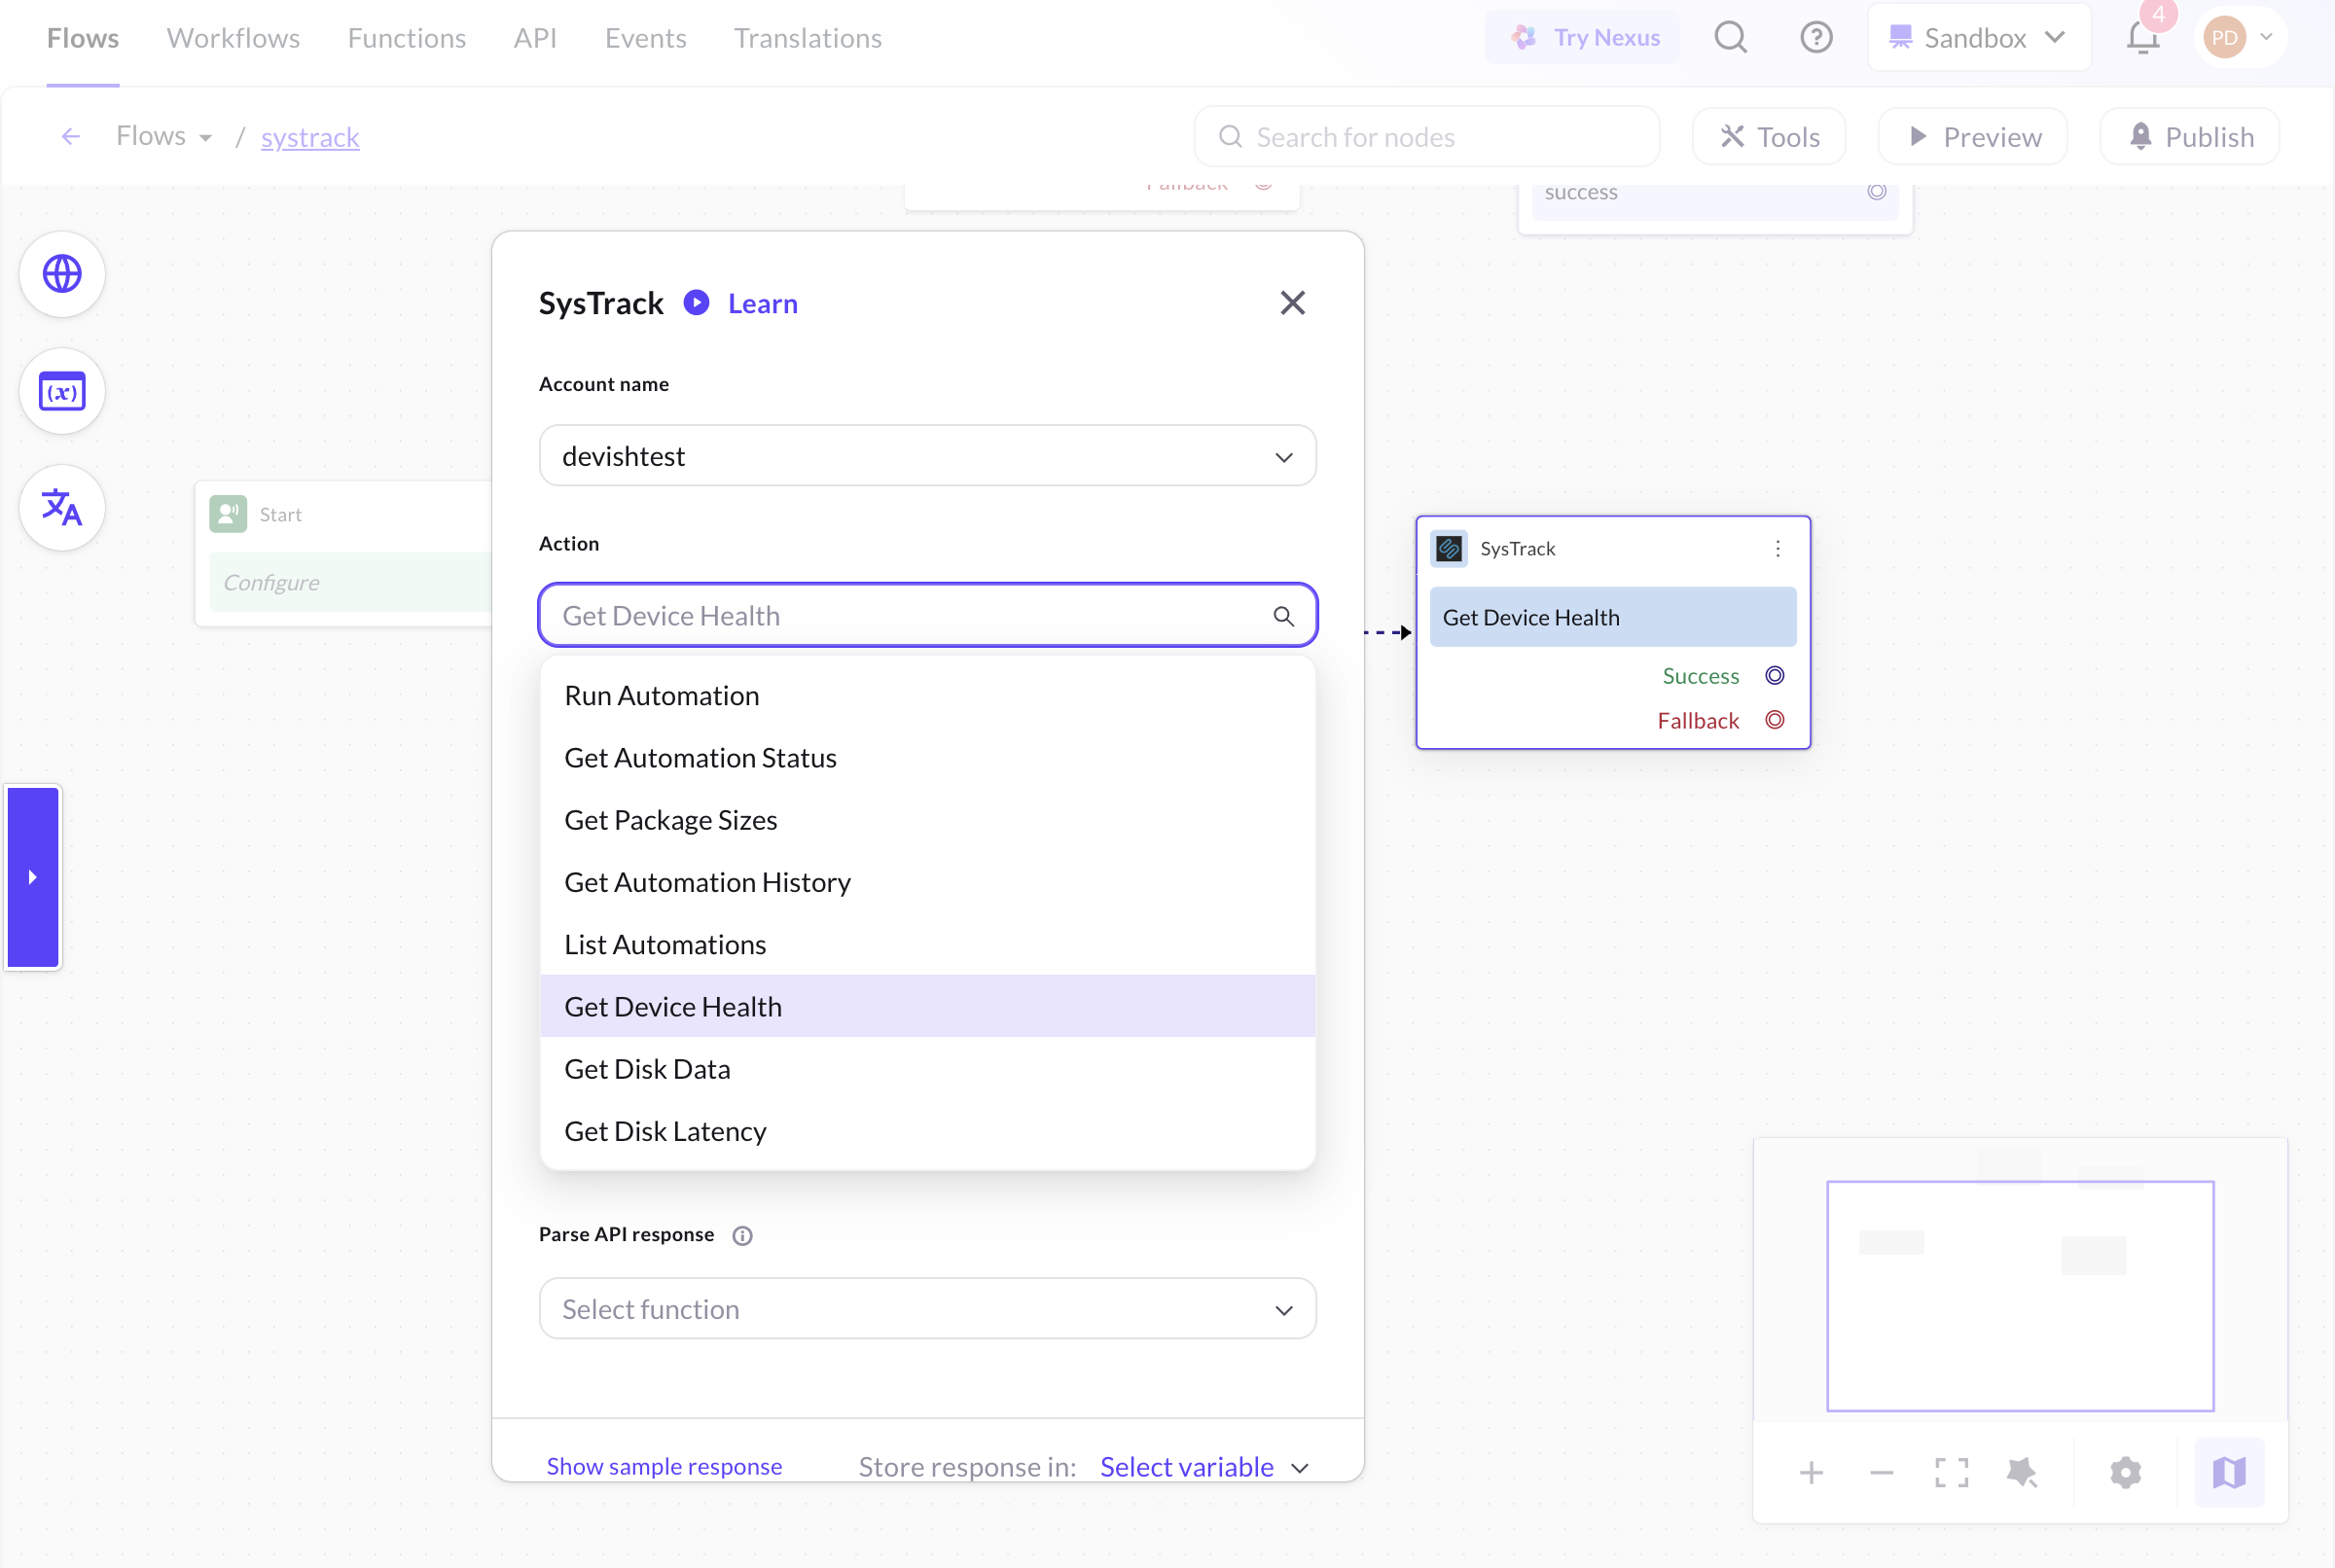
Open the node and select the Account name to use, then choose an Action.
-
Fill in the action's fields. You can pass values from variables, such as a system GUID stored from an earlier action.
-
In Store response in, select a variable to hold the response, and use it in later nodes. Click Show sample response to see the shape of the data the action returns.
-
Connect the Success path to the next step, and the Fallback path to how you want to handle errors. See Errors.
Identifying a system
Most actions need the system you want to act on. Depending on the action, it accepts:
- System GUID, such as
3f2b8c1e-7a4d-4e9b-9c61-2d5f8a0b4e17, or - System (GUID or FQDN), where you can also pass the fully qualified domain name, such as
LAPTOP-JDOE01.example.com.
If you only know the user, call Get systems by user first and take sysGuid from the response.
Time ranges
Fields named Start Time and End Time take ISO 8601 timestamps in UTC, for example 2026-07-01T00:00:00Z. The start time must be before the end time.
Detail level
Some performance actions accept an optional Detail Level: low (default), medium, high or automatic. Higher detail returns more data points.
Actions
| Area | Actions |
|---|---|
| Automations | Run automation, Get automation status, Get automation history, List automations |
| Device health and performance | Get device health, Get disk data, Get disk latency, Get gateway latency, Get uptime, Get counter data |
| Sensors and events | Get active sensors, Get activated sensors, Get sensor definitions, Get system events (child) |
| Inventory | Get inventory, Get package sizes, List inventory classes, Get inventory metadata |
| Groups and users | List groups, Get group, Get group systems, Get group device health, Get group inventory, Get group users, Get systems by user |
| Surveys and engagements | List surveys, Get survey questions, Get survey results, List engagements, Run engagement |
Automations
Run automation
Runs a SysTrack automation (sensor action) on a system. The response includes a BatchId. Pass it to Get automation status to check whether the run succeeded.
POST /api/sensoractions/run
| Field | Required | Description | Example |
|---|---|---|---|
| System GUID | Yes | The system to run the automation on. | 3f2b8c1e-7a4d-4e9b-9c61-2d5f8a0b4e17 |
| Automation Profile ID | Yes | The profileID of the automation. Get it from List automations. | Device_Restart_Profile |
| Action To Take | Yes | How to run the automation. Execute Now (1) is the only option and is selected by default. | 1 |
Request body sent to SysTrack:
{
  "systems": ["3f2b8c1e-7a4d-4e9b-9c61-2d5f8a0b4e17"],
  "executePackages": [
    { "profileID": "Device_Restart_Profile", "actionToTake": "1" }
  ]
}
Sample response:
{
  "BatchId": "00000000-0000-0000-0000-000000000000",
  "NumSystemsSentTo": 1
}
Get automation status
Checks the status of an automation batch started with Run automation. It works only for runs started through the API or by autofix.
GET /api/tools/automation/status?system={system}&batchId={batchId}
| Field | Required | Description | Example |
|---|---|---|---|
| System GUID | Yes | The system the automation ran on. | 3f2b8c1e-7a4d-4e9b-9c61-2d5f8a0b4e17 |
| Batch ID | Yes | The BatchId returned by Run automation. | 00000000-0000-0000-0000-000000000000 |
Possible status values:
| Status | Meaning |
|---|---|
SUCCESS | The automation finished. It may not have changed anything. |
ERROR | The automation failed. |
RUNNING | The automation is still running. Check again later. |
TIMED_OUT | The automation did not finish in time. |
DUPLICATE | The same automation was already running on the system. |
USER_DECLINED | The user declined the automation. |
UNKNOWN | SysTrack could not determine the status. |
Sample response:
{
  "batchId": "00000000-0000-0000-0000-000000000000",
  "status": "RUNNING"
}
Get automation history
Returns the automations that ran on a system in a time range, with the automation name, run time, trigger type and who triggered it.
GET /api/toolhistory/automations/systems/{systemId}?startTime={startTime}&endTime={endTime}
| Field | Required | Description | Example |
|---|---|---|---|
| System (GUID or FQDN) | Yes | The system to get history for. | 3f2b8c1e-7a4d-4e9b-9c61-2d5f8a0b4e17 |
| Start Time | Yes | Start of the time range. | 2026-07-01T00:00:00Z |
| End Time | Yes | End of the time range. | 2026-07-13T23:59:59Z |
This action confirms that an automation ran, but not always whether it succeeded. returnCode, duration and interactionUser can be null, and errorDetails can read Not Found when SysTrack did not capture an outcome. To check the result of a specific run, use Get automation status with its batch ID.
Sample response:
{
  "data": [
    {
      "automationName": "Fix_DNS_Cache",
      "publisherName": "Lakeside Software, Inc",
      "runAsUser": null,
      "commandLine": "\"fixDNSCache.bat\"",
      "runTimestamp": "2026-07-15T11:58:12.0000000Z",
      "duration": null,
      "returnCode": null,
      "errorDetails": "Not Found",
      "triggerType": "Manual",
      "triggeredBy": "API Key:SysTrackAPI:RW 10001",
      "interactionType": "Not Supported",
      "interactionUser": null
    }
  ]
}
List automations
Lists the automations (sensor actions) available in your SysTrack environment. Use the profileID from the response in Run automation.
GET /api/sensoractions
This action has no input fields.
Sample response:
{
  "value": [
    {
      "profileID": "Device_Restart_Profile",
      "name": "Restart Device",
      "description": "Restarts the target device"
    },
    {
      "profileID": "Clear_Cache_Profile",
      "name": "Clear Cache",
      "description": "Clears application and system cache"
    }
  ]
}
Device health and performance
Get device health
Returns daily health scores for a system and the minutes affected by each type of issue (CPU, memory, disk, network, latency, startup and others).
GET /api/systems/{sysGuid}/devicehealth?startTime={startTime}&endTime={endTime}
| Field | Required | Description | Example |
|---|---|---|---|
| System GUID | Yes | The system to check. | 3f2b8c1e-7a4d-4e9b-9c61-2d5f8a0b4e17 |
| Start Time | Yes | Start of the time range. | 2026-07-01T00:00:00Z |
| End Time | Yes | End of the time range. | 2026-07-13T23:59:59Z |
Sample response:
{
  "data": [
    {
      "systemId": "3f2b8c1e-7a4d-4e9b-9c61-2d5f8a0b4e17",
      "systemName": "LAPTOP-JDOE01.example.com",
      "date": "2026-07-13T00:00:00.0000000Z",
      "activeMinutes": 420,
      "impactedMinutes": 67,
      "healthScore": 84.04799885717007,
      "cpu": 30,
      "memory": 0,
      "disk": 64,
      "network": 1,
      "latency": 1,
      "startup": 0,
      "virtual": 0,
      "virtualMachine": 0,
      "install": 0,
      "update": 0,
      "event": 0,
      "fault": 0,
      "hardwareProblem": 0
    }
  ]
}
Get disk data
Returns disk activity for a system: busy time, free space, queue length, reads, writes and bytes transferred.
GET /api/systems/{systemId}/disk?startTime={startTime}&endTime={endTime}&detail={detail}
| Field | Required | Description | Example |
|---|---|---|---|
| System (GUID or FQDN) | Yes | The system to check. | 3f2b8c1e-7a4d-4e9b-9c61-2d5f8a0b4e17 |
| Start Time | Yes | Start of the time range. | 2026-07-01T00:00:00Z |
| End Time | Yes | End of the time range. | 2026-07-13T23:59:59Z |
| Detail Level | No | low (default), medium, high or automatic. | low |
Sample response:
{
  "status": [],
  "data": [
    {
      "logicaldisk": "Macintosh HD",
      "percentdisktime": 0.33,
      "percentfreespace": 0.41,
      "queuelength": 0,
      "reads": 745,
      "writes": 399,
      "readbytes": 29634183,
      "writebytes": 21651947,
      "transfertime": 0.00034,
      "recordtype": 2,
      "nodataintable": false,
      "nodatapoint": false,
      "wtime": "2026-07-09T04:32:28Z"
    }
  ]
}
Get disk latency
Returns average, last, minimum and maximum disk latency for each disk on a system.
GET /api/systems/{systemId}/latency/disk?startTime={startTime}&endTime={endTime}&detail={detail}
| Field | Required | Description | Example |
|---|---|---|---|
| System (GUID or FQDN) | Yes | The system to check. | 3f2b8c1e-7a4d-4e9b-9c61-2d5f8a0b4e17 |
| Start Time | Yes | Start of the time range. | 2026-07-01T00:00:00Z |
| End Time | Yes | End of the time range. | 2026-07-13T23:59:59Z |
| Detail Level | No | low (default), medium, high or automatic. | low |
Sample response:
{
  "status": [],
  "data": [
    {
      "avg": 0.35,
      "last": 0.58,
      "max": 0.51,
      "min": 0.26,
      "unit": "Macintosh HD",
      "nodataintable": false,
      "nodatapoint": false
    }
  ]
}
Get gateway latency
Returns network response times from a system to its gateway, along with the network adapter, IP addresses and location.
GET /api/systems/{systemId}/latency/gateway?startTime={startTime}&endTime={endTime}&user={user}
| Field | Required | Description | Example |
|---|---|---|---|
| System (GUID or FQDN) | Yes | The system to check. | 3f2b8c1e-7a4d-4e9b-9c61-2d5f8a0b4e17 |
| Start Time | Yes | Start of the time range. | 2026-07-01T00:00:00Z |
| End Time | Yes | End of the time range. | 2026-07-13T23:59:59Z |
| User | No | Limit results to one user's sessions. | EXAMPLE\jdoe |
Sample response:
{
  "status": [],
  "data": [
    {
      "avgresptime": 12,
      "minresptime": 2.94,
      "maxresptime": 1423.75,
      "resptime": 14.15,
      "caption": "en0",
      "gatewayip": "192.0.2.1",
      "ipaddress": "192.0.2.25",
      "macaddress": "00:00:5e:00:53:01",
      "geo": { "city": "London", "country": "GB", "region": "ENG" }
    }
  ]
}
Get uptime
Returns the power state and uptime of one or more systems.
GET /api/systems/uptime?systemId={systemId}
| Field | Required | Description | Example |
|---|---|---|---|
| System GUID | Yes | One system GUID, or several separated by colons (guid1:guid2). | 3f2b8c1e-7a4d-4e9b-9c61-2d5f8a0b4e17 |
In the response, uptime is in seconds (for example, 582712 is about 6.7 days) and systemstate is the power state, such as SystemOn.
Sample response:
{
  "status": [],
  "data": [
    {
      "sessionsactive": 0,
      "systemstate": "SystemOn",
      "uptime": 582712,
      "usage": 0,
      "wguid": "3f2b8c1e-7a4d-4e9b-9c61-2d5f8a0b4e17"
    }
  ]
}
Get counter data
Returns time-series values of a performance counter on a system, such as CPU, memory, GPU, battery or network usage.
GET /api/counters/system/{counterId}/{systemId}?startTime={startTime}&endTime={endTime}&detail={detail}&bucketWidth={bucketWidth}&instance={instance}
| Field | Required | Description | Example |
|---|---|---|---|
| Counter ID | Yes | The counter to read. See the common counters below. | 80 |
| System (GUID or FQDN) | Yes | The system to check. | 3f2b8c1e-7a4d-4e9b-9c61-2d5f8a0b4e17 |
| Start Time | Yes | Start of the time range. | 2026-07-01T00:00:00Z |
| End Time | Yes | End of the time range. | 2026-07-13T23:59:59Z |
| Detail Level | No | low (default), medium, high or automatic. | low |
| Bucket Width | No | Group data points into buckets of this many seconds. | 3600 |
| Instance | No | A process ID for process counters, or _Total. | _Total |
Common counters:
| Counter ID | Counter |
|---|---|
80 | % Total CPU |
265 | Memory % Used |
516 | GPU % Total Usage |
666 | % Battery |
46 | Net KByte Rate |
503 | Health Score |
Negative counter IDs are process counters. Use them with Instance set to the process ID.
In the response, val is the value and time is the sample time. A unit of "100" means the value is a percentage. The data[0].data array can contain many points, so summarise it (average, peak or latest value) before showing it to the user.
Sample response:
{
  "status": [],
  "data": [
    {
      "id": 80,
      "obj": "System",
      "ctr": "% Total CPU",
      "unit": "100",
      "detail": "Medium",
      "valuetype": "Average",
      "explanation": "The % Total CPU Time is the percentage of elapsed time that all processors are busy.",
      "data": [
        { "val": 36.75, "time": "2026-07-20T00:26:56.0000000Z" },
        { "val": 28.87, "time": "2026-07-20T03:45:10.0000000Z" }
      ]
    }
  ]
}
Sensors and events
Get active sensors
Returns the sensors currently active on a system, with their latest values.
GET /api/systems/{sysGuid}/sensors/active
| Field | Required | Description | Example |
|---|---|---|---|
| System GUID | Yes | The system to check. | 3f2b8c1e-7a4d-4e9b-9c61-2d5f8a0b4e17 |
Sample response:
{
  "value": [
    {
      "sensorId": "sensor-cpu-001",
      "name": "CPU Usage",
      "status": "active",
      "currentValue": 72.4,
      "unit": "%",
      "lastPolled": "2026-07-13T08:28:00Z"
    }
  ]
}
Get activated sensors
Returns the sensors that were triggered on a system in a time range, with their severity and category.
GET /api/sensors/{sysGuid}?startTime={startTime}&endTime={endTime}&source={source}&sensorName={sensorName}&includePayloads={includePayloads}
| Field | Required | Description | Example |
|---|---|---|---|
| System GUID | Yes | The system to check. | 3f2b8c1e-7a4d-4e9b-9c61-2d5f8a0b4e17 |
| Start Time | Yes | Start of the time range. | 2026-07-01T00:00:00Z |
| End Time | Yes | End of the time range. | 2026-07-13T23:59:59Z |
| Inventory Source | No | master or child database. | child |
| Sensor Name Filter | No | Return only sensors whose name matches. | Health Score Low |
| Include Payloads | No | true to include sensor payloads, false to leave them out. | false |
Sample response:
{
  "status": [],
  "data": [
    {
      "SensorId": "a3e6c398-8af4-41c3-b499-724c035be8ed",
      "Name": "Available Bandwidth Below Limit",
      "Triggered": true,
      "TriggerCount": 1,
      "Severity": 4,
      "IsHidden": 0,
      "ResultTime": "2026-07-08T00:00:00.0000000Z",
      "SensorCategory": "Network"
    },
    {
      "SensorId": "3b7927b9-5065-4f66-ae1d-548a57c5309e",
      "Name": "Health Score Low",
      "Triggered": true,
      "TriggerCount": 1,
      "Severity": 7,
      "IsHidden": 0,
      "ResultTime": "2026-07-08T00:00:00.0000000Z",
      "SensorCategory": "End-User Experience"
    }
  ]
}
Get sensor definitions
Returns the definitions of the sensors in your SysTrack environment, with a description and category for each.
GET /api/sensors/definitions?sensorName={sensorName}
| Field | Required | Description | Example |
|---|---|---|---|
| Sensor Name Filter | No | Return only sensors whose name matches. | Available Bandwidth Below Limit |
Sample response:
{
  "data": [
    {
      "sensorId": "61fec83a-1ab8-4689-a177-0376c91cfe7b",
      "sensorName": "1E Client Service Stopped",
      "description": "The 1E Client Service is not running.",
      "category": "System",
      "instanceName": ""
    },
    {
      "sensorId": "a3e6c398-8af4-41c3-b499-724c035be8ed",
      "sensorName": "Available Bandwidth Below Limit",
      "description": "The average Available Bandwidth for the system is below the defined limit.",
      "category": "Network",
      "instanceName": ""
    }
  ]
}
Get system events (child)
Returns event and alarm history for a system from the child database, including application crashes and software changes.
GET /api/events/child/{sysGuid}?startTime={startTime}&endTime={endTime}&trimLogItems={trimLogItems}
| Field | Required | Description | Example |
|---|---|---|---|
| System GUID | Yes | The system to check. | 3f2b8c1e-7a4d-4e9b-9c61-2d5f8a0b4e17 |
| Start Time | Yes | Start of the time range. | 2026-07-01T00:00:00Z |
| End Time | Yes | End of the time range. | 2026-07-13T23:59:59Z |
| Trim Log Items | No | true to shorten log entries in the response. | true |
How to read the response:
- Application crashes have
typeset toApplication Error,measset toThe application quit unexpectedly, and a realpid. For these,alarmclassisnull, so usetypeinstead. - Software changes have
alarmclassset toChange Management,measset toaddedordeleted, andpidset to-1. Anaddedanddeletedpair for the same item at the same time is a version update, not an install and an uninstall. endis always a date before 1900 because events have no end time. Ignore it.sevis the default severity of the alarm class, not always how serious the event is. Don't present software changes to users as high severity.
Sample response:
{
  "status": [],
  "data": [
    {
      "sysId": "3f2b8c1e-7a4d-4e9b-9c61-2d5f8a0b4e17",
      "alarmclass": "Change Management",
      "classid": 8,
      "type": null,
      "typeid": 13,
      "item": "Software:Google Chrome (Google LLC)",
      "sev": 2,
      "start": "2026-07-17T12:23:44.0000000Z",
      "end": "1899-12-30T00:00:00.0000000Z",
      "meas": "added",
      "pid": -1,
      "class": "Change Management",
      "kind": "Event"
    },
    {
      "sysId": "3f2b8c1e-7a4d-4e9b-9c61-2d5f8a0b4e17",
      "alarmclass": null,
      "classid": 13,
      "type": "Application Error",
      "typeid": 58,
      "item": "assistantd",
      "sev": 2,
      "start": "2026-07-21T12:04:36.0000000Z",
      "end": "1899-12-30T00:00:00.0000000Z",
      "meas": "The application quit unexpectedly",
      "pid": 172,
      "class": null,
      "kind": "Event"
    }
  ]
}
Inventory
Get inventory
Returns hardware and software inventory for a system.
GET /api/inventory/{sysGuid}?source={source}&classes={classes}
| Field | Required | Description | Example |
|---|---|---|---|
| System GUID | Yes | The system to check. | 3f2b8c1e-7a4d-4e9b-9c61-2d5f8a0b4e17 |
| Inventory Source | No | master or child database. | master |
| Inventory Classes | No | Comma-separated list of classes to return. Get the names from List inventory classes. | cpu,memory |
Sample response:
{
  "value": [
    {
      "class": "Win32_PhysicalMemory",
      "source": "master",
      "items": [
        {
          "capacity": 17179869184,
          "manufacturer": "Samsung",
          "partNumber": "M471A2K43CB1-CTD",
          "speed": 2667
        }
      ]
    },
    {
      "class": "Win32_DiskDrive",
      "source": "master",
      "items": [
        { "model": "Samsung SSD 860", "size": 512110190592, "status": "OK" }
      ]
    }
  ]
}
Get package sizes
Returns the packages installed on a system with their size, install date and last-used date. Use it to find the largest apps, or large apps that haven't been used recently.
GET /api/packages/sizes/child/{systemId}?packageId={packageId}&appId={appId}&appVerId={appVerId}
| Field | Required | Description | Example |
|---|---|---|---|
| System (GUID or FQDN) | Yes | The system to check. | 3f2b8c1e-7a4d-4e9b-9c61-2d5f8a0b4e17 |
| Package ID | No | Return only this package. | 5472 |
| App ID | No | Return only this application. | — |
| App Version ID | No | Return only this application version. Use it together with App ID. | — |
In the response, installsize is in MB (for example, 2128 is about 2 GB). Sort by installsize in descending order to find the largest packages. metadata.TotalCount is the number of packages returned.
Sample response:
{
  "metadata": { "TotalCount": 19 },
  "status": [],
  "data": [
    {
      "packId": 5472,
      "packName": "Docker",
      "publisher": "Docker Inc.",
      "version": "4.82.0",
      "installsize": 2128.951,
      "installed": "2026-07-10T09:08:15.0000000Z",
      "lastused": "2026-07-22T00:41:08.0000000Z",
      "fqdn": "LAPTOP-JDOE01.example.com",
      "osname": "macOS Version 15.7.7",
      "sysId": "3f2b8c1e-7a4d-4e9b-9c61-2d5f8a0b4e17",
      "sysName": "LAPTOP-JDOE01"
    }
  ]
}
List inventory classes
Lists the inventory classes you can request in Get inventory and Get group inventory.
GET /api/inventory
This action has no input fields.
Sample response:
{
  "status": [],
  "data": [
    { "class": "battery" },
    { "class": "bios" },
    { "class": "cpu" },
    { "class": "logicaldisk" },
    { "class": "memory" },
    { "class": "operatingsystem" },
    { "class": "software" },
    { "class": "system" }
  ]
}
Get inventory metadata
Returns the fields available in an inventory class, with their data types and descriptions.
GET /api/inventory/metadata/{inventoryClass}
| Field | Required | Description | Example |
|---|---|---|---|
| Inventory Class | No | The class to describe. Leave it empty to get metadata for all classes. | memory |
Sample response:
{
  "class": "Win32_PhysicalMemory",
  "fields": [
    { "name": "Capacity", "type": "uint64", "description": "Total size in bytes" },
    { "name": "Manufacturer", "type": "string", "description": "RAM manufacturer" },
    { "name": "Speed", "type": "uint32", "description": "Speed in MHz" }
  ]
}
Groups and users
List groups
Lists the groups in your SysTrack environment.
GET /api/groups?q={q}&limit={limit}
| Field | Required | Description | Example |
|---|---|---|---|
| Search Query | No | Return only groups that match this text. | Finance |
| Limit | No | The maximum number of groups to return. | 50 |
Sample response:
{
  "value": [
    {
      "groupName": "grp-001",
      "name": "Finance Department",
      "deviceCount": 142,
      "description": "All finance team endpoints"
    },
    {
      "groupName": "grp-002",
      "name": "Engineering",
      "deviceCount": 380,
      "description": "Engineering department endpoints"
    }
  ]
}
Get group
Returns details of a group, including its type and the number of systems in it.
GET /api/groups/{groupName}
| Field | Required | Description | Example |
|---|---|---|---|
| Group Name | Yes | The group to look up. | Physical Systems |
Sample response:
{
  "status": [],
  "data": [
    {
      "isdefault": false,
      "realtime": false,
      "name": "Physical Systems",
      "type": 1,
      "syscnt": 3801
    }
  ]
}
Get group systems
Returns the systems in a group, with hardware, OS, agent version, IP address and online status.
GET /api/groups/{groupName}/systems
| Field | Required | Description | Example |
|---|---|---|---|
| Group Name | Yes | The group to look up. | Physical Systems |
Sample response:
{
  "status": null,
  "data": [
    {
      "guid": "8d41a7c2-5e3f-4b18-a9d6-7c0e2f91b354",
      "sysGuid": "8d41a7c2-5e3f-4b18-a9d6-7c0e2f91b354",
      "name": "DESKTOP-FIN042",
      "fqdn": "DESKTOP-FIN042",
      "chassis": "Desktop",
      "os": "Microsoft Windows 11 Pro",
      "ostype": "Windows",
      "agentVer": "11.7.0.6",
      "mfgr": "Dell Inc.",
      "model": "OptiPlex 7010",
      "cpu": "12th Gen Intel(R) Core(TM) i5-12400F",
      "procs": 12,
      "mem": 17026183168,
      "ip": "192.0.2.41",
      "licensetype": "Workstation",
      "lastused": "2026-07-12T01:29:04.2530000Z",
      "status": "Offline",
      "onlinestatus": "SystemOff"
    }
  ]
}
Get group device health
Returns the health score and status of each device in a group. Results are paginated.
GET /api/groups/{groupName}/devicehealth?pageNumber={pageNumber}
| Field | Required | Description | Example |
|---|---|---|---|
| Group Name | Yes | The group to check. | Finance Department |
| Page Number | No | The page of results to return. | 1 |
Sample response:
{
  "groupName": "Finance Department",
  "totalDevices": 142,
  "pageNumber": 1,
  "value": [
    {
      "systemGuid": "f2d6e4f9-1ccc-44d3-9dec-1737df2d1bd4",
      "deviceName": "LAPTOP-XYZ",
      "healthScore": 91,
      "status": "healthy",
      "lastUpdated": "2026-07-13T08:30:00Z"
    },
    {
      "systemGuid": "a1b2c3d4-5678-90ab-cdef-1234567890ab",
      "deviceName": "DESKTOP-ABC",
      "healthScore": 54,
      "status": "degraded",
      "lastUpdated": "2026-07-13T08:25:00Z"
    }
  ]
}
Get group inventory
Returns one inventory class for every system in a group.
GET /api/groups/{groupName}/systems/inventory/{inventoryClass}
| Field | Required | Description | Example |
|---|---|---|---|
| Group Name | Yes | The group to look up. | Physical Systems |
| Inventory Class | Yes | The class to return, such as cpu, memory, software or logicaldisk. | memory |
Sample response:
{
  "groupName": "grp-001",
  "inventoryClass": "Win32_PhysicalMemory",
  "value": [
    {
      "systemGuid": "f2d6e4f9-1ccc-44d3-9dec-1737df2d1bd4",
      "items": [
        { "capacity": 17179869184, "manufacturer": "Samsung", "speed": 2667 }
      ]
    }
  ]
}
Get group users
Returns the users in a group.
GET /api/groups/{groupName}/users
| Field | Required | Description | Example |
|---|---|---|---|
| Group Name | Yes | The group to look up. | Physical Systems |
Sample response:
{
  "status": [],
  "data": [
    { "account": 9111, "fullname": "Jane Doe", "username": "EXAMPLE\\jdoe" },
    { "account": 9112, "fullname": "Alex Smith", "username": "EXAMPLE\\asmith" }
  ]
}
Get systems by user
Returns the systems a user signs in to, with hardware, OS, IP address and online status. Use it to find the system GUID that the other actions need.
GET /api/systems/users?user={username}
| Field | Required | Description | Example |
|---|---|---|---|
| Username | Yes | The user's SysTrack username, usually in DOMAIN\user format. | EXAMPLE\jdoe |
Sample response:
{
  "status": [],
  "data": [
    {
      "username": "EXAMPLE\\jdoe",
      "userstatus": "Unknown",
      "usersystemstatus": "",
      "userlastused": "2026-07-13T05:44:33.0000000Z",
      "guid": "3f2b8c1e-7a4d-4e9b-9c61-2d5f8a0b4e17",
      "sysGuid": "3f2b8c1e-7a4d-4e9b-9c61-2d5f8a0b4e17",
      "name": "LAPTOP-JDOE01",
      "fqdn": "LAPTOP-JDOE01.example.com",
      "chassis": "Laptop",
      "os": "macOS Version 15.7.7 (Build 24G720)",
      "ostype": "Mac",
      "mfgr": "Apple Inc.",
      "model": "MacBook Air (M1, 2020)",
      "cpu": "Apple M1",
      "procs": 8,
      "mem": 8589934592,
      "ip": "192.0.2.25",
      "licensetype": "Workstation",
      "lastused": "2026-07-13T05:44:33.0000000Z",
      "status": "Online",
      "onlinestatus": "SystemOn"
    }
  ]
}
Surveys and engagements
List surveys
Lists the surveys in your SysTrack environment.
GET /api/surveys
This action has no input fields.
Sample response:
{
  "value": [
    {
      "surveyId": "survey-001",
      "name": "Employee Experience Survey Q2",
      "description": "Quarterly endpoint experience feedback",
      "questionCount": 10,
      "isActive": true
    }
  ]
}
Get survey questions
Returns the questions in a survey, with the question type, whether it's required, and the answer options.
GET /api/surveys/{surveyId}/questions
| Field | Required | Description | Example |
|---|---|---|---|
| Survey ID | Yes | The survey to look up. | 10001 |
Sample response:
{
  "data": [
    {
      "surveyId": 10001,
      "surveyName": "Device Experience Survey",
      "questions": [
        {
          "id": 7,
          "text": "Please provide a rating for your overall device experience.",
          "responseType": "Number",
          "questionType": "Slider",
          "isRequired": true,
          "defaultValue": "0",
          "options": {
            "values": [
              { "display": "0", "value": "0" },
              { "display": "50", "value": "50" },
              { "display": "100", "value": "100" }
            ]
          }
        },
        {
          "id": 9,
          "text": "Describe your device experience. Is there anything we should focus on?",
          "responseType": "Text",
          "questionType": "Text",
          "isRequired": false,
          "defaultValue": "",
          "options": { "values": [] }
        }
      ]
    }
  ]
}
Get survey results
Returns the responses submitted for a survey.
GET /api/surveys/{surveyId}/results
| Field | Required | Description | Example |
|---|---|---|---|
| Survey ID | Yes | The survey to get results for. | 10001 |
Sample response (a survey with no responses yet):
{
  "data": []
}
List engagements
Lists the engagements in your SysTrack environment. An engagement is a message shown on the user's device, with buttons that can open a link or run an automation.
GET /api/engagements
This action has no input fields.
Sample response:
{
"data": [
{
"id": 11002,
"name": "Device Performance Issue",
"createdOn": "2026-02-16T06:13:00",
"buttons": [
{ "id": 1007, "text": "Log your ticket", "url": "https://helpdesk.example.com" },
{
"id": 1008,
"text": "Run Disk CleanUp",
"automation": {
"id": "f7fb9844-24c0-4913-a8a9-8d44b18a2813",
"name": "AdvancedDiskClean",
"requiredParameters": []
}
}
]
}
]
}
Run engagement
Shows an engagement on a system. Get the engagement ID from List engagements.
POST /api/engagements/{engagementId}/run
| Field | Required | Description | Example |
|---|---|---|---|
| Engagement ID | Yes | The engagement to run. | 11002 |
| System GUID | Yes | The system to show the engagement on. | 3f2b8c1e-7a4d-4e9b-9c61-2d5f8a0b4e17 |
Request body sent to SysTrack:
{
  "systems": ["3f2b8c1e-7a4d-4e9b-9c61-2d5f8a0b4e17"]
}
Sample response:
{
  "success": true,
  "engagementId": "eng-001",
  "message": "Engagement dispatched successfully",
  "targetCount": 142
}
Example: diagnose and fix a slow laptop
A common flow for an IT help desk AI agent:
- Ask the user for their username, then call Get systems by user and store
sysGuid. - Call Get device health for the last 7 days to see which areas (CPU, memory, disk, network) are affecting the device.
- Call Get system events (child) to check for recent application crashes.
- If disk is the problem, call Get package sizes to find large apps the user hasn't used recently.
- Offer a fix, then call Run automation with the right profile ID from List automations.
- Call Get automation status with the returned
BatchIdand tell the user the result.
Errors
When a SysTrack request fails, the node returns one of these errors. Owner shows who usually needs to fix it: Customer (your SysTrack setup or credentials) or Developer (the values passed by the flow).
| HTTP status | Error status | Code | Meaning | Owner |
|---|---|---|---|---|
| 400 | INVALID_FIELD_VALUE | 8001 | A field value is invalid, such as a malformed GUID or timestamp. | Developer |
| 401 | AUTHENTICATION_FAILURE | 8002 | The API token is wrong or expired. Update it in the integration account. | Customer |
| 403 | RESOURCE_ACCESS_DENIED | 9001 | The API key doesn't have permission for this action. | Customer |
| 404 | RESOURCE_NOT_FOUND | 8003 | The system, group, automation, survey or engagement doesn't exist. | Developer |
| 207 | SYSTEM_OFFLINE | 8004 | The system is offline or unreachable, so SysTrack couldn't get live data from it. | Customer |
| 429 | API_LIMIT_REACHED | 9002 | The SysTrack API rate limit was reached. Wait and try again. | Customer |