Debug flows
The Flow Debugger allows AI-agent developers to inspect variables and track changes in their values at each node level. By enabling step-by-step flow execution through breakpoints, it facilitates the rapid identification of logic and runtime errors, aiding in efficient debugging processes
To debug your flows:
Set up breakpoints
Breakpoints serve as special markers that pause flow execution at designated points. Currently, we support breakpoints only at the node level.
-
Go to Automation and open the flow you'd like to debug.
-
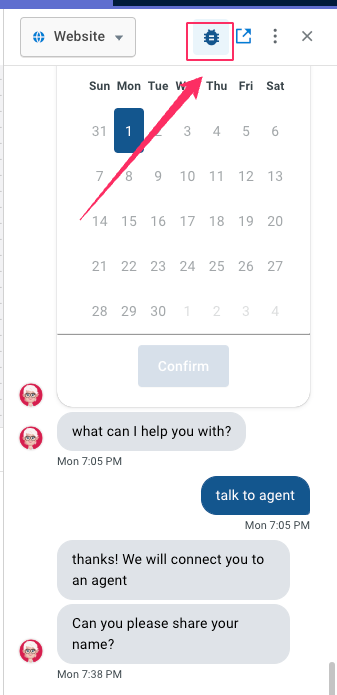
Click Preview > debug icon.

-
Click the Debugger tab. To know about how console works, click here.

-
Click the Start debugging option to start the debug session.

After initiating the debugging session, node breakpoints become visible, allowing users to set them at specific nodes.

-
To set a breakpoint, click the breakpoint button on the node. This stops the flow execution once the control reaches that node.

-
To disable the breakpoint, reclick the breakpoint on the specific node. Disabling a breakpoint for a node allows the flow execution to proceed normally without any interruption.
Start debugging the flow
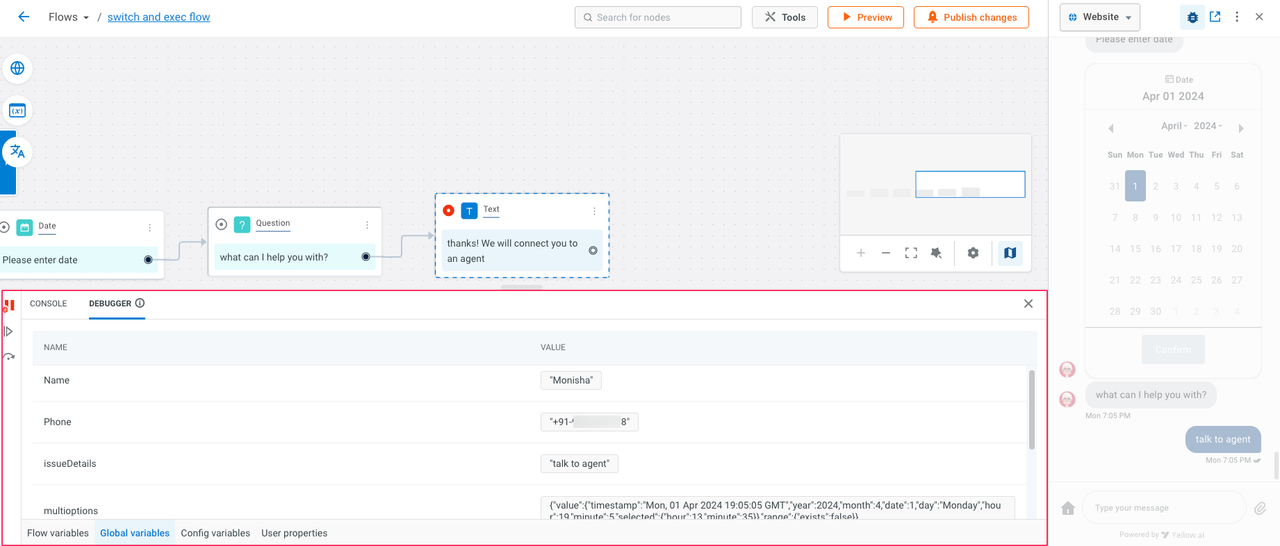
Once the breakpoints are set, preview the flow. The flow execution will stop when it reaches a breakpoint node. An active breakpoint looks like the node highlighted in the image below.

The widget interaction will also be disabled at this point.
The Debugger section will reflect the current state of variables or the values stored in those variables at the particular point of flow execution.
-
The debugger section can be resized, with the default height set at 30% of the builder area's height and adjustable up to a maximum of 50%.
-
Breakpoints are applicable across multiple flows, when a flow execution switches to another flow using the Execute flow node, the new flow containing the breakpoint will automatically load.
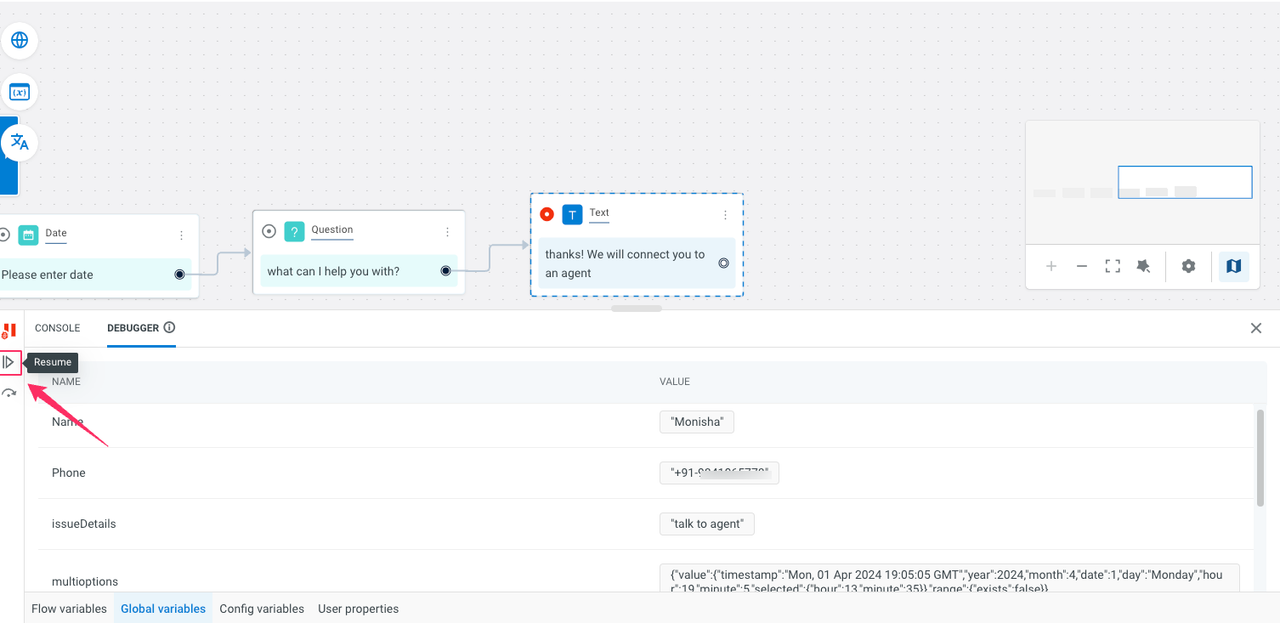
Resume flow execution from a breakpoint
When the flow execution halts at a breakpoint, resuming will restart the execution until it reaches the next breakpoint, if any. Click the resume button to continue the flow.
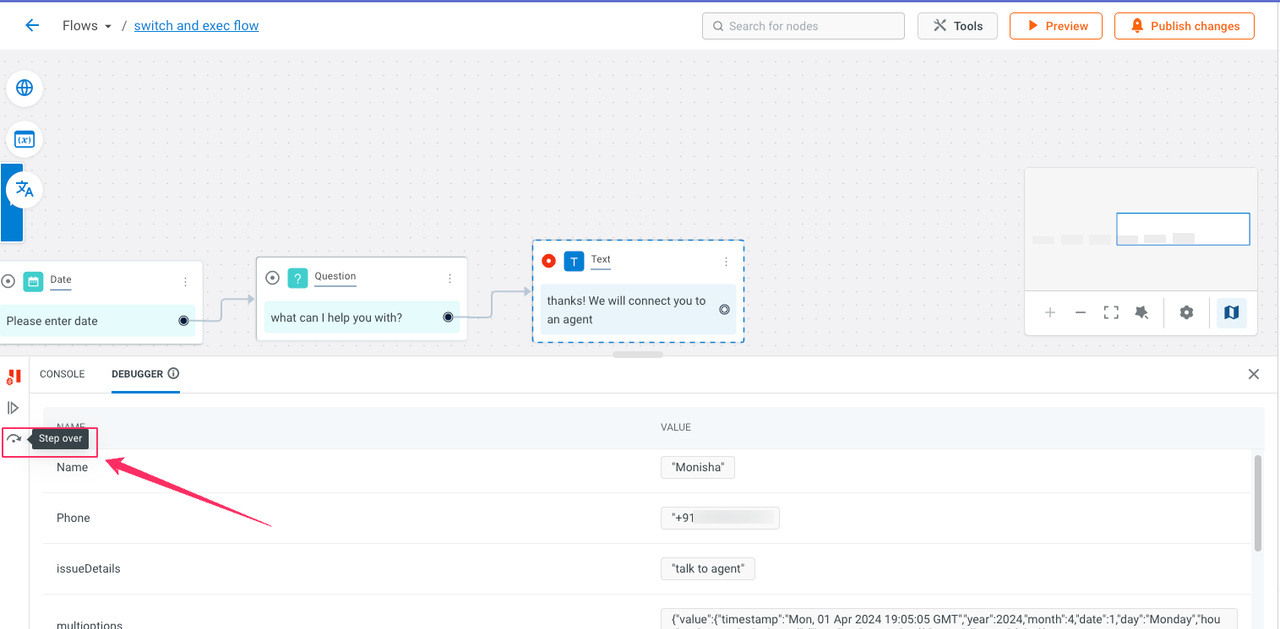
Step over a breakpoint
Step over lets you proceed to the next step after the breakpoint, resembling the execution of a function one node at a time and moving over to the subsequent line. Click Step over to proceed to the next step.
End the debugging session
You can close a debugging session by three ways:
-
Click the red pause button on the debugging session.

-
From the Debugger section.
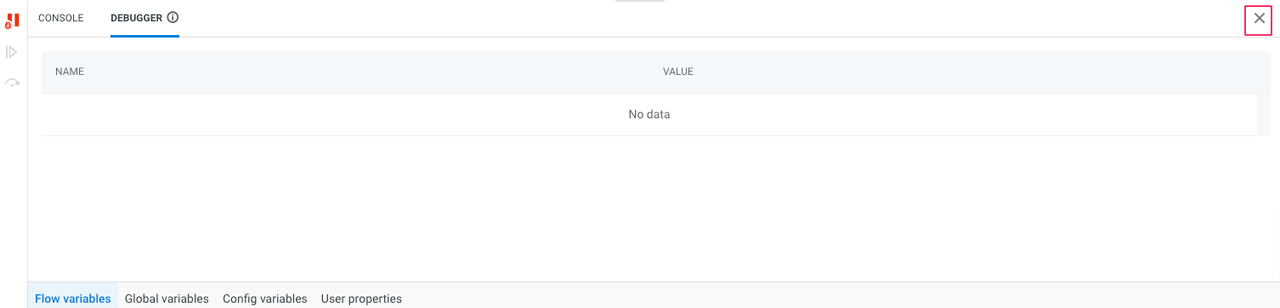
-
From the flow preview section.