Understand flow-related details using funnels
In this article, you will learn how to use the Funnels section to monitor:
Access funnels
In order to gain deeper insights into user journeys(flows), you can explore Funnels. This section allows you to view data collected across all user journeys or flows, accessed through various channels. To view funnels data:
- Open Insights > User journeys.
- Select the Funnels tab.

Filter funnels data for a time period
- From the drop-down menu, select the desired time period, such as the last 7 days or the last 90 days.
- If you need to view metrics for a custom range, click on Custom and select the specific start and end dates.

Export/download funnels data
To download Flows summary and Flow day wise data reports, follow these steps:
- Click on Export data.
- Select the metrics you require.
- Click Export reports. You can also choose to download all the reports as a PDF.
For instructions on scheduling these reports, refer to these steps.

Filter funnels data for different channels
The metrics in the Funnels section are measured across all channels. If you want to obtain results for specific channels that are activated for your bot, from the Channel dropdown, select the desired channel. The metrics will be filtered and displayed based on the selected channel.

Monitor top flows completed
The Top Flows Completed widget displays the top 5 flows (intents) completed by users, along with the Flow Completion Rate, for the selected time period.
You can also filter the graph to focus on a specific flow.

Analyse step wise interactions
The Stepwise Interactions widget provides a step-by-step funnel of a selected flow. It shows the number of users who moved from one step to another, as well as those who dropped off in between. This helps in understanding user engagement at different levels of the journey.
Example to understand step wise interaction
One of the primary use cases in the Funnels section is to understand the number of users dropping off at different levels of their journey. You can select the specific journey you want to analyze from the dropdown menu. Follow these steps:
- From the dropdown menu, select the journey(flow) you want to view.
- The graph will display the steps or nodes within the selected journey.

Let's consider the example flow Booking:
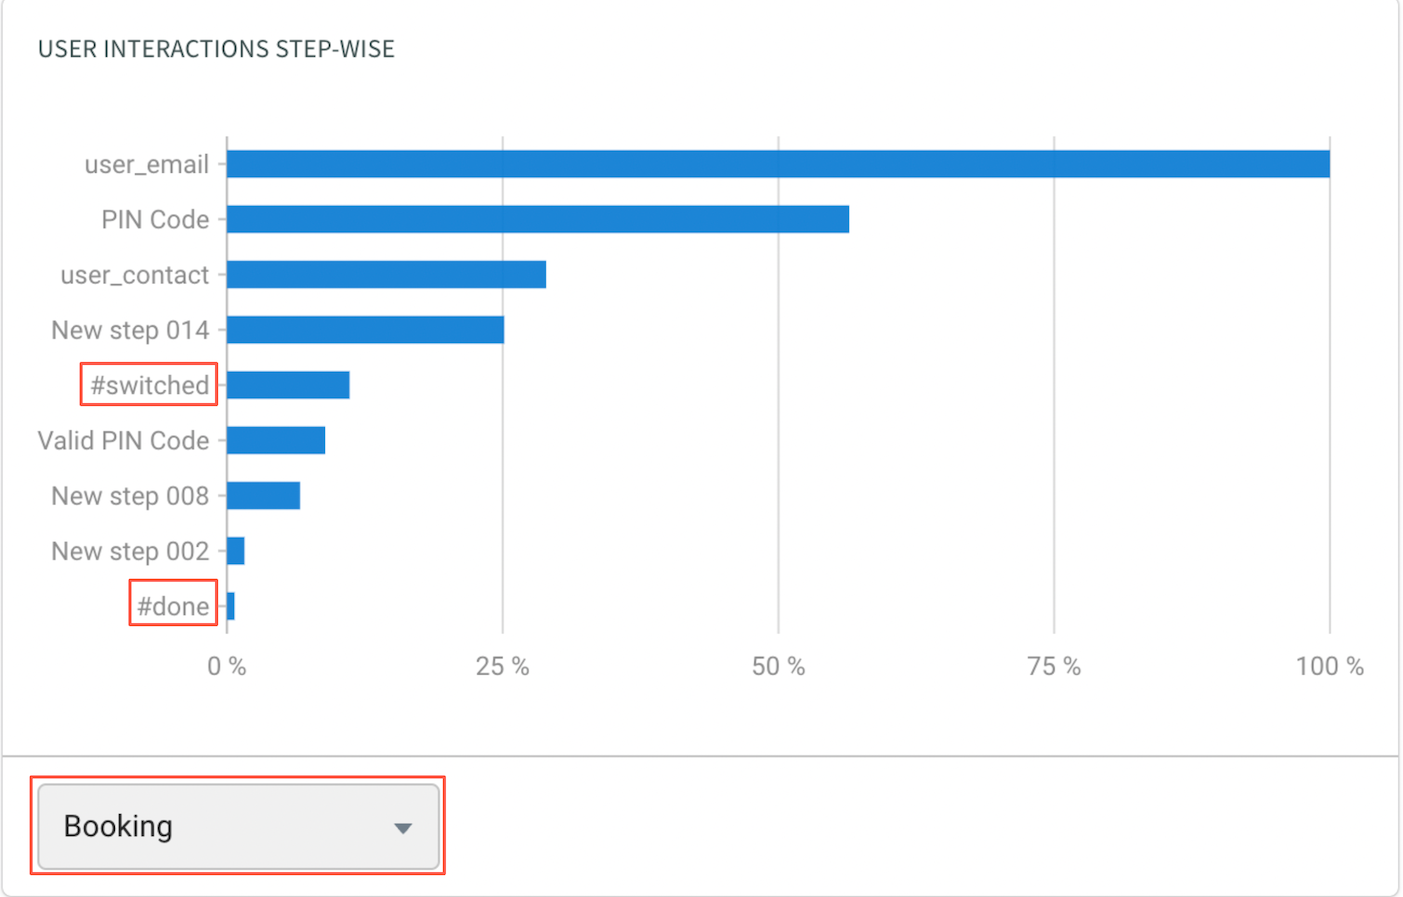
The graph will include two default bars for all flows:
- #done: Represents the users who completed the entire journey.
- #switched: Represents the users who switched to some other journey.
In addition, other bars represent the node names or numbers within the selected flow. By analyzing the graph, you can understand how many users completed each specific step. For example, you can understand that 100% of the users entered their email (user_email), while only 30% of the users entered their phone numbers (user_contact).
Analyzing the steps helps identify potential bottlenecks or areas where users drop off.
Flows summary
The Flows Summary table provides essential information about flow completion rates, the number of times flows were triggered, and the overall flow contribution to traffic. You can search for specific flows and sort the table based on different criteria.
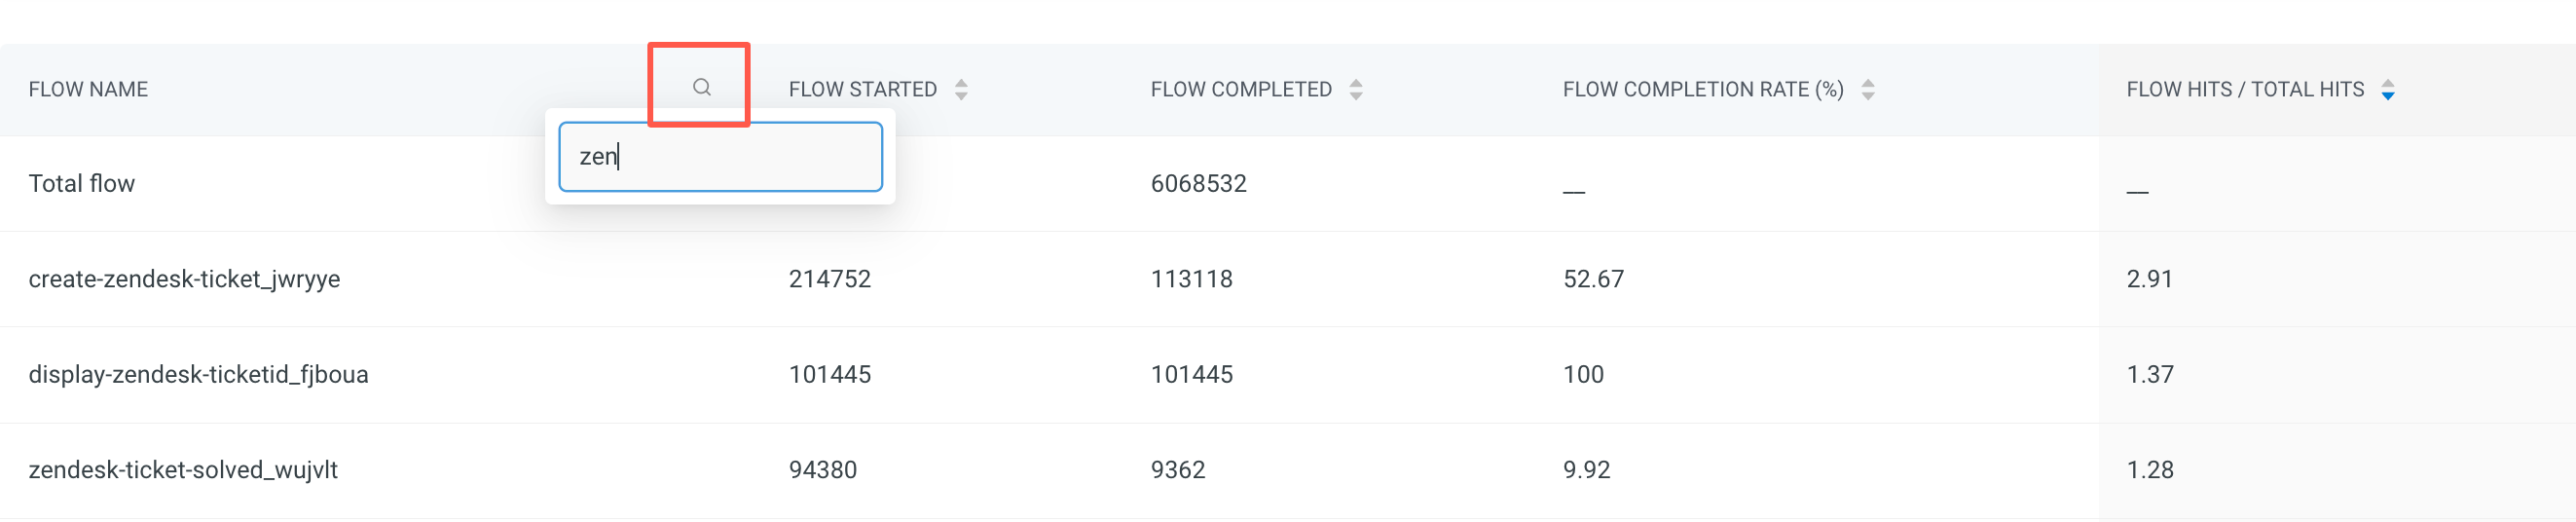
- Flow name: This is listed out for all the flows, you can search for the required flow.
- Flow started: Number of times a journey was started.
- Flow completed: Number of times a journey was completed.
- Flow completion rate (%): Flow completion rate/FCR of each journey.
- Flow hits / total hits: Ratio of the Journey Hits to overall traffic (where the flow hits value is the number of times a journey was started).
Sort these values by clicking the column name.
Analyse flow completion rate (FCR)
The Flow Completion Rate (FCR) section displays the average flow completion rate for all flows within the selected date range. If the FCR is low, you can click on Know why! to analyze the underlying data and identify potential areas for improvement.
In the below example the FCR is 14%.

The Low FCR Reasons tab provides insights into why certain flows have low completion rates and suggests immediate steps to enhance them. By clicking on the provided links, you can further analyze and optimize your bot flows.
Detailed reasons for Low FCR
| Reason | Resolution |
|---|---|
| Users are dropping off without completing the flow | Use the Stepwise Interactions widget in the Funnels section to identify which steps within the flow users are dropping off the most. This analysis will help pinpoint specific areas that may be causing user abandonment. |
| Users are switching to other flows without completing the concerned flow | Explore the User Journey Visualisation feature to understand which flows and steps users are switching to instead of completing the concerned flow. This analysis will provide insights into user behavior and help identify factors contributing to flow abandonment. |
| Complicated or redundant step structure in the flow | Navigate to the Builder and evaluate each step of the concerned flow. Check for any complications or redundancies in the flow structure that may confuse or deter users. Simplify and streamline the flow by removing unnecessary steps and ensuring it aligns with the intended use case. |
| Users have never triggered certain flows | Identify flows with zero start counts, indicating that users are not triggering or utilizing them at all. Evaluate if these flows need to be modified or removed entirely in the Builder to declutter and optimize the user experience. |
| Other issues such as missing bot response, long response time, etc. | Low FCR can be caused by technical issues such as missing bot responses or long response times. Access the Conversation Logs in the Studio to search for sessions with relevant tags indicating these issues. Resolve any technical issues that may impact user engagement and completion rates. |