Create Dashboards and add widgets
Actions in Dashboard must be configured separately for Live and Production environment.
Custom dashboards overview
A dashboard is a visual display of your bot data that provides information at a glance. It has its own dedicated page and receives information from a linked database that can be configured according to your needs. You can choose the data you want to see and visualize it using charts or graphs.
Here are the features of the insights dashboard:
- You can create Multiple Dashboards. In this, each dashboard can include multiple widgets (reports).
- Widgets are the saved reports that are present on the data explorer page. The dashboard helps the analysts to add multiple widgets to the single page layout.
- Widgets can be directly added to the Dashboard from the data explorer.

Usecase of insight dashboard
Dashboards are useful for organizing and analyzing data based on common themes. For example, if your company has three different types of products and you want to check the analytics for each product separately but in the same place, you can create dashboards for each product and add relevant metrics to each dashboard. This allows you to view all the connected values under one view.
Access dashboards
To view existing dashboards, go to the Insights section and select Dashboards. You can have multiple dashboards, and each dashboard can contain multiple widgets.
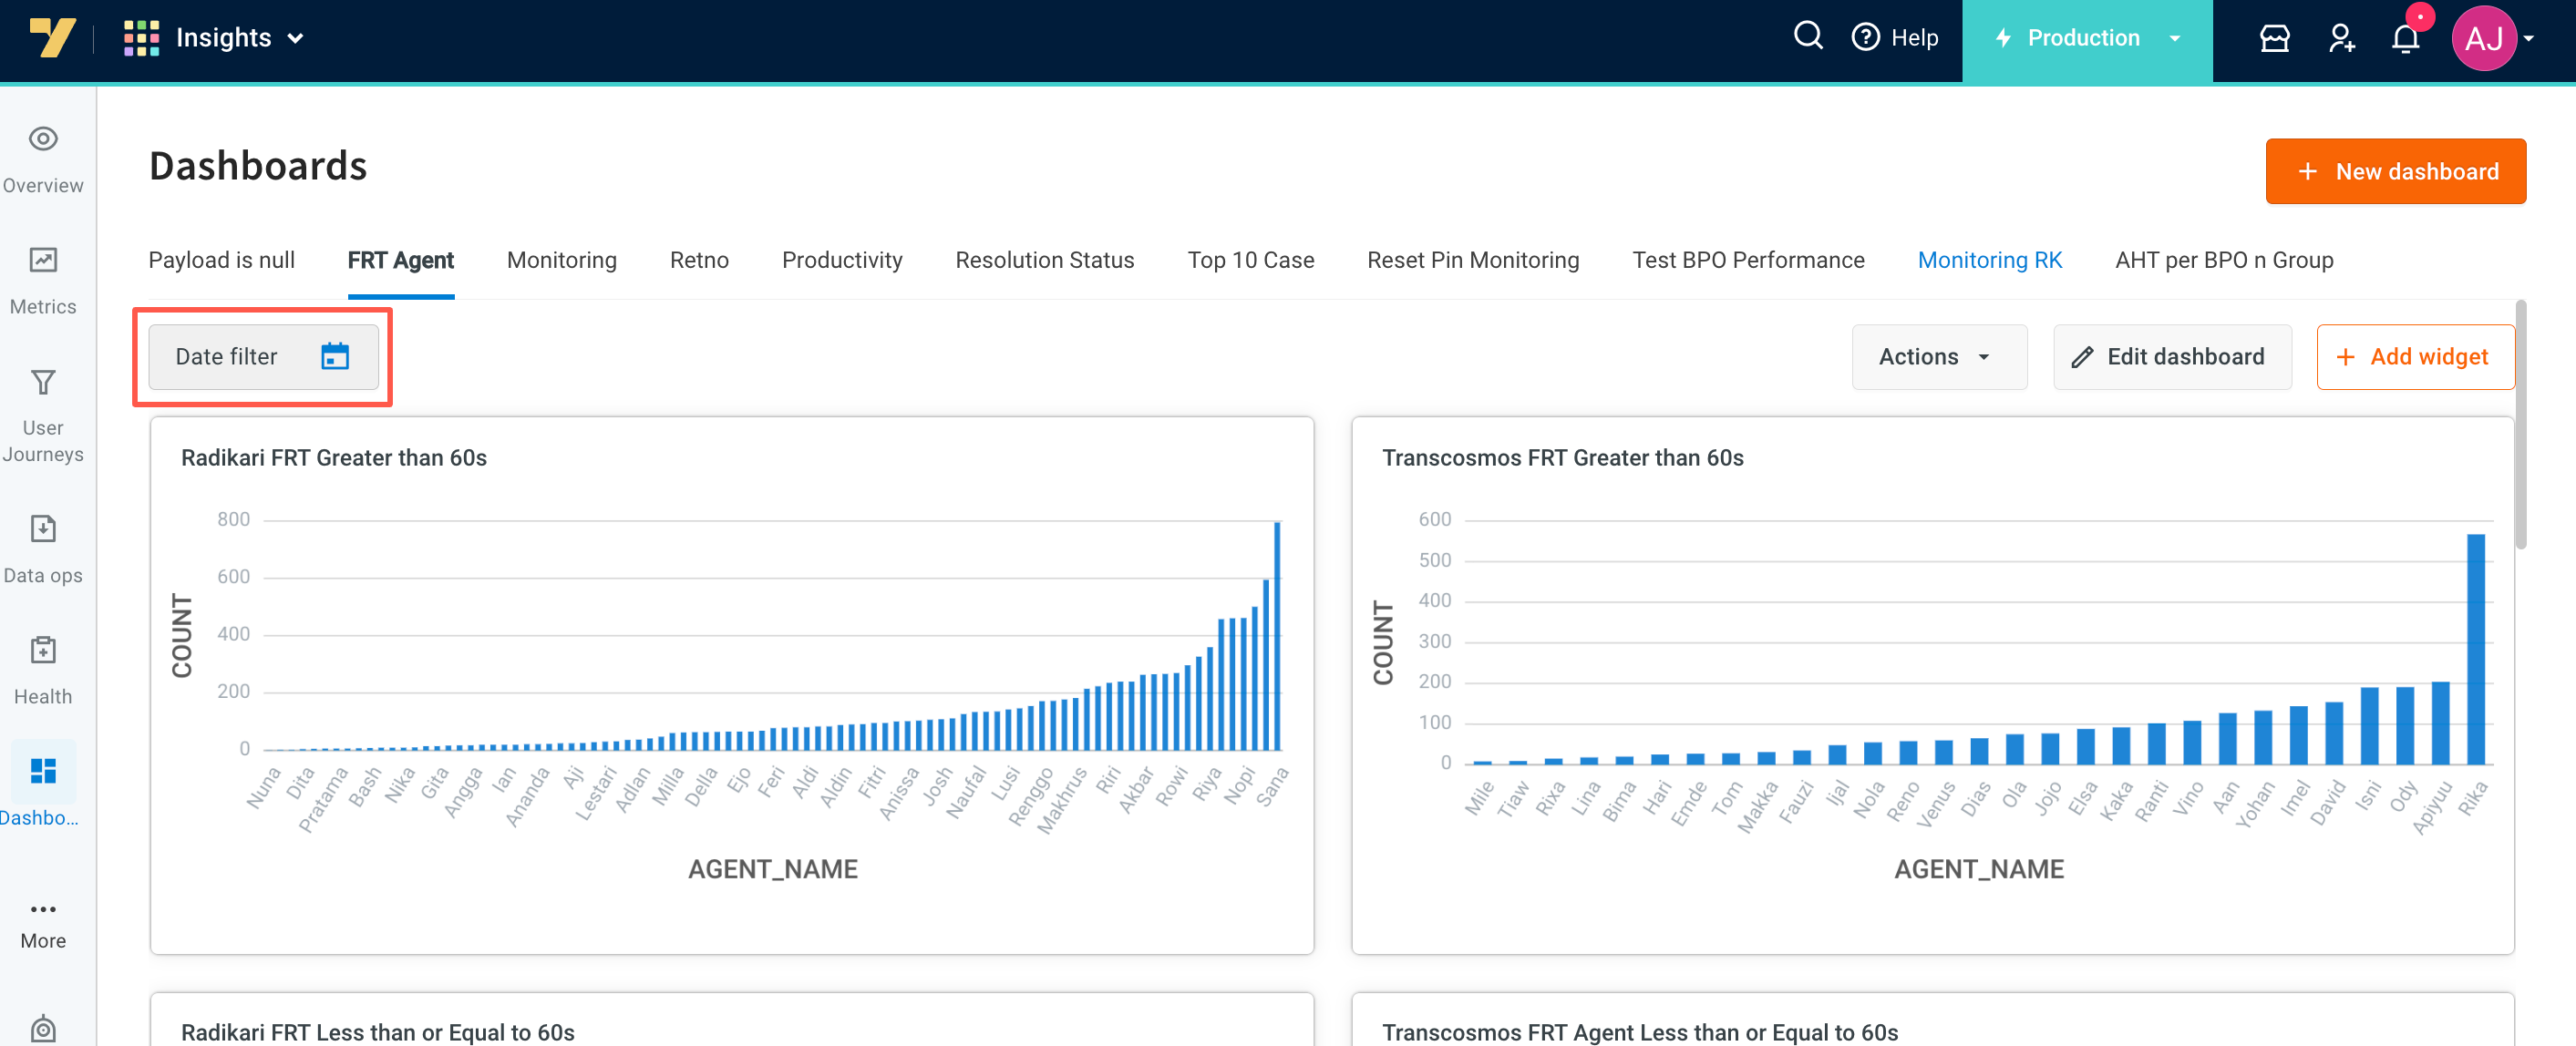
Filter dashboard data for a time period
Irrespective of the filters added to the saved reports(widgets) you can add a data filter to your dashboard from the top left to specify a time period. This filter applies to all the widgets on the dashboard and allows you to focus on specific data within a given time frame.

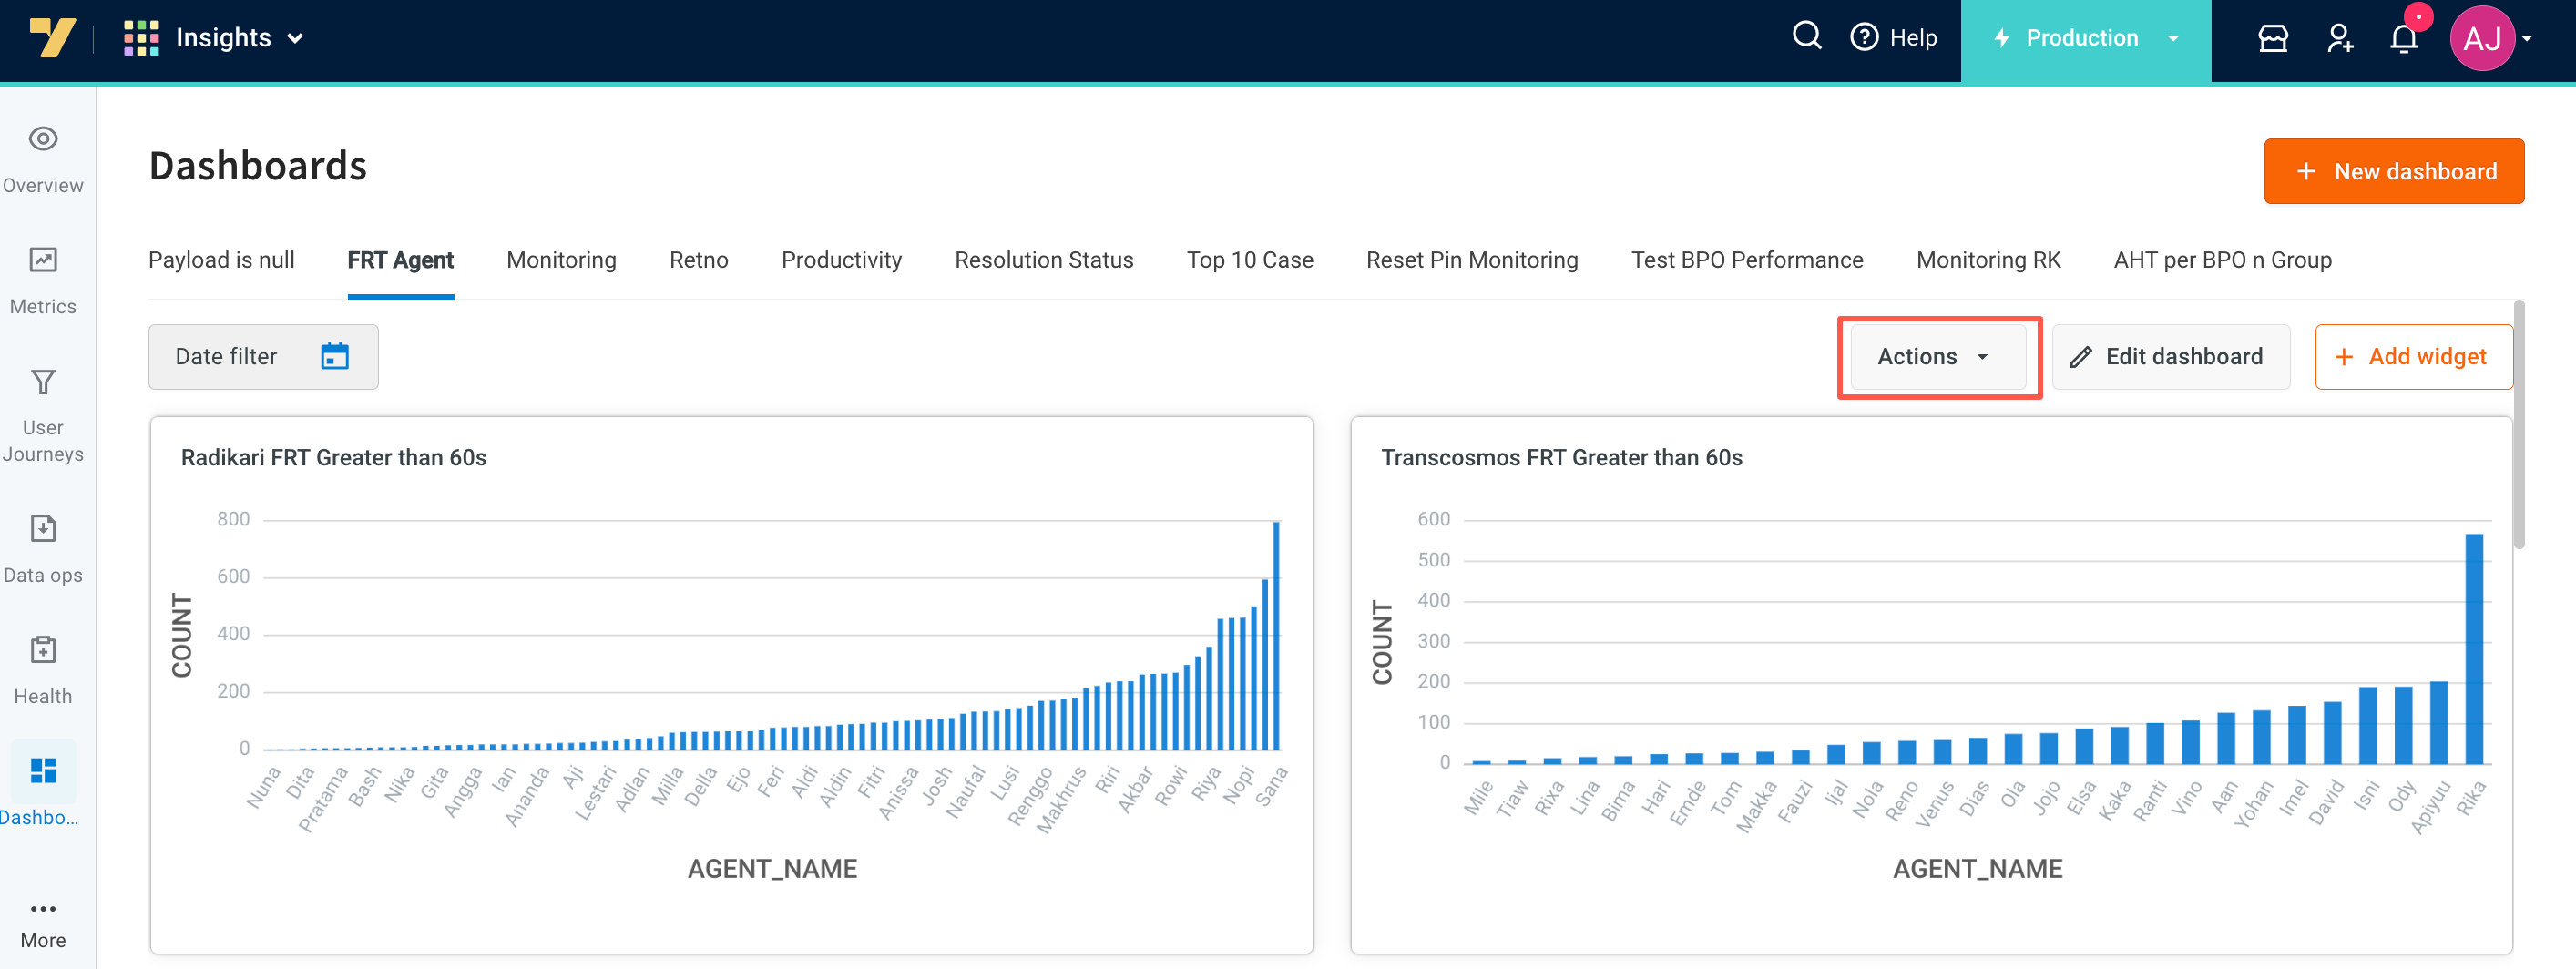
Delete dashboard
If you want to delete a dashboard, click Actions at the top right corner of the dashboard and select Delete.

Create a Dashboard
You can create a dashboard using either of the following methods:
Method 1: Create a dashboard from the dashboard page
- Login to yellow.ai. Go to Overview. Open Insights > Dashboard.
- Click +Add new dashboard or +New dasbhoard from the top right.
- On the Dashboard details pop-up, enter Name and Description.
- Click Save.

Method 2: Create a dashboard from Data explorer (Saved reports)
Prerequisites: Data explorer
- Login to yellow.ai, click on Overview. Open Insights > Data explorer.
- Click and open any of the saved reports.

- From Actions dropdown, select Add to dashboard.
- Select New dashboard. Add Name and Description (the saved report that you have selected is going to be the widget inside a dashboard. You can choose to add this widget to an existing dashboard or you can create a new dashboard and add this widget to it).
- Click Save. You can view this on the dashboard page.

All the changes made in the Saved reports are automatically updated on the Dashboard.
Add saved reports as widget on dashboard
To add a saved report as a widget to a dashboard:
- To add a widget to a new dashboard, you must have an existing saved report on the data explorer page. Click +Add widget. You will be prompted to create a new widget.

To learn more about creating a saved report, refer to custom tables.

- To add a widget to a dashboard with existing widgets, click +Add widget on the top right. Select from the existing widgets (reports). Multiple reports can be selected at once. You can also click +Create new widget to create new widgets.

- Click Add.
Edit dashboard
To edit a dashboard:
- Click Edit dashboard at the top right corner.
- You can change the Name and Description of the dashboard.
- Add more widgets to the dashboard or delete existing widgets.
- Rearrange the widgets by dragging and dropping them.
- Click Save to apply the changes.
