Analytics overview
The Overview page provides a high-level snapshot of agent performance, user engagement, and conversation trends. It helps you quickly understand how your AI agent and human agents are performing, what users are talking about, and where improvements can be made.
The Overview page is your single dashboard for:
- Tracking adoption and usage growth.
- Monitoring automation efficiency (containment, AI agent involvement).
- Identifying key conversation topics and sentiment shifts.
- Understanding user demographics and behavior.
To access the Analytics overview page, go Analytics > Overview

Filters in Overview
The Overview dashboard includes filters that let you customize the data view. These filters make it easier to drill-down into relevant timeframes and channels for precise performance evaluation.
-
Time range
- Last 7 days – View short-term performance and recent trends.
- Last 30 days – Track medium-term patterns and stability.
- Custom – Select any specific date range for deeper analysis.
-
Channels
- All channels (default) – Combined data across all support channels.
- Voice – Filter to only see insights from voice interactions.
- Web chat – Focus exclusively on chat-based conversations.
Agent Performance
This section highlights metrics derived from conversations analyzed by AI.
- Total conversations – Total conversations handled by your AI agent and human agents.
- Analyzed conversations – Subset of conversations reviewed by AI for insights.
Resolution Rate
Resolution rate represents the percentage of conversations that were successfully resolved across all topics within a conversation. A conversation is considered resolved when the user’s query is fully addressed without requiring further escalation.
What it shows
- A timeline view of resolved conversations, helping you analyze resolution trends over time.
- A comparison of resolution performance between AI Agents and Human Agents, so you can see how much each contributes to overall query resolution.
Resolution Rate = Resolved conversations ÷ Total analyzed conversations A conversation is considered resolved when the user does not express dissatisfaction for any topic within it. Conversations where only some topics are resolved are not included in this metric.
Resolution Rate Split
Resolution rate split provides a breakdown of analyzed conversations by their resolution outcome. Instead of just showing the overall resolution percentage, it categorizes conversations into distinct resolution states.
Resolution states
- Resolved – The conversation was successfully completed, and the user’s query was addressed.
- Unresolved – The query could not be resolved.
- User drop-off – The user exited the conversation before it was completed.
- Partially resolved – Some parts of the user’s request were addressed, but not fully resolved.
What it shows
- A distribution view of all analyzed conversations, grouped by outcome.
- Helps you identify where conversations are getting completed, abandoned, or left partially handled.
Available filters
- All (default) – Shows outcomes across both AI and Human agents.
- AI Agent – Focuses on outcomes where the AI Agent handled the conversation.
- Human Agent – Focuses on outcomes where a live agent handled the conversation.
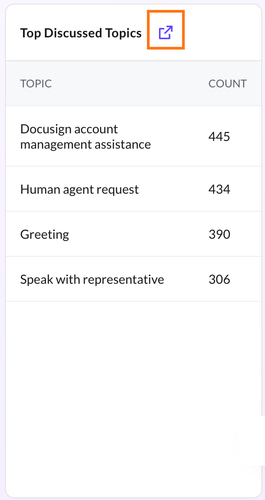
Top discussed topics
Displays the most frequently occurring categories in analyzed conversations, along with their occurrence count (Topic – Count). This gives you a clear view of what users engage with the most.
Click the link on this card to navigate to Conversations > Topics for the full list of topics and detailed counts.
Containment Rate
Containment rate measures the percentage of conversations that were fully handled by the AI Agent without requiring a handoff to a human agent.
What it shows
- Tracks how effectively the AI Agent can manage end-to-end conversations.
- Provides a time-based view of containment, helping you monitor improvements or declines over specific periods.
A higher containment rate indicates stronger automation, reduced dependency on human agents, and improved cost efficiency. A lower containment rate may suggest gaps in the AI Agent’s training, prompts, or workflows that need optimization.
User Sentiment
User sentiment analysis measures how customers feel during conversations, based on AI-driven sentiment detection. Each conversation is categorized as Happy, Neutral, or Unhappy.
What it shows
- Displays sentiment trends over time, helping you track how customer experience evolves.
- Shows the share of each sentiment category as percentages for the selected period.
Usage Trends
Usage Trends highlight overall engagement levels on your platform. The metrics reflect activity across all conversations within the selected time frame.
What it shows
- Users – Unique users interacting with the agent.
- Messages – Total number of exchanged messages.
- Conversations – Number of conversations started.
- Average session duration – Typical duration of a user’s session.
User Split
Breakdown of users across different dimensions displayed in pie chart for easy comparison. By default, it shows the report by channels. The following are the different filters available:
- Channel – Voice, Web chat, WhatsApp
- Device – Desktop vs. mobile.
- Country – Geographic distribution of users.
AI Agent Involvement
This metric shows how much of the overall support workload is being managed by AI Agents. It reflects the distribution of conversations between automation (AI Agents) and human agents.
What it shows
- Breaks down conversations handled partially or fully by AI Agents versus those requiring human intervention.
- Highlights how often AI Agents are engaged within conversations, giving visibility into their contribution across support operations.