Reports
The Reports surface is the per-run breakdown — what happened on a single BulkSimulationReport, which simulations passed, which failed, what each evaluator scored, and how that maps back to the test cases in the dataset.
Two pages: the Reports list (every historical run) and the Individual Report (one run's detail).
Reports list
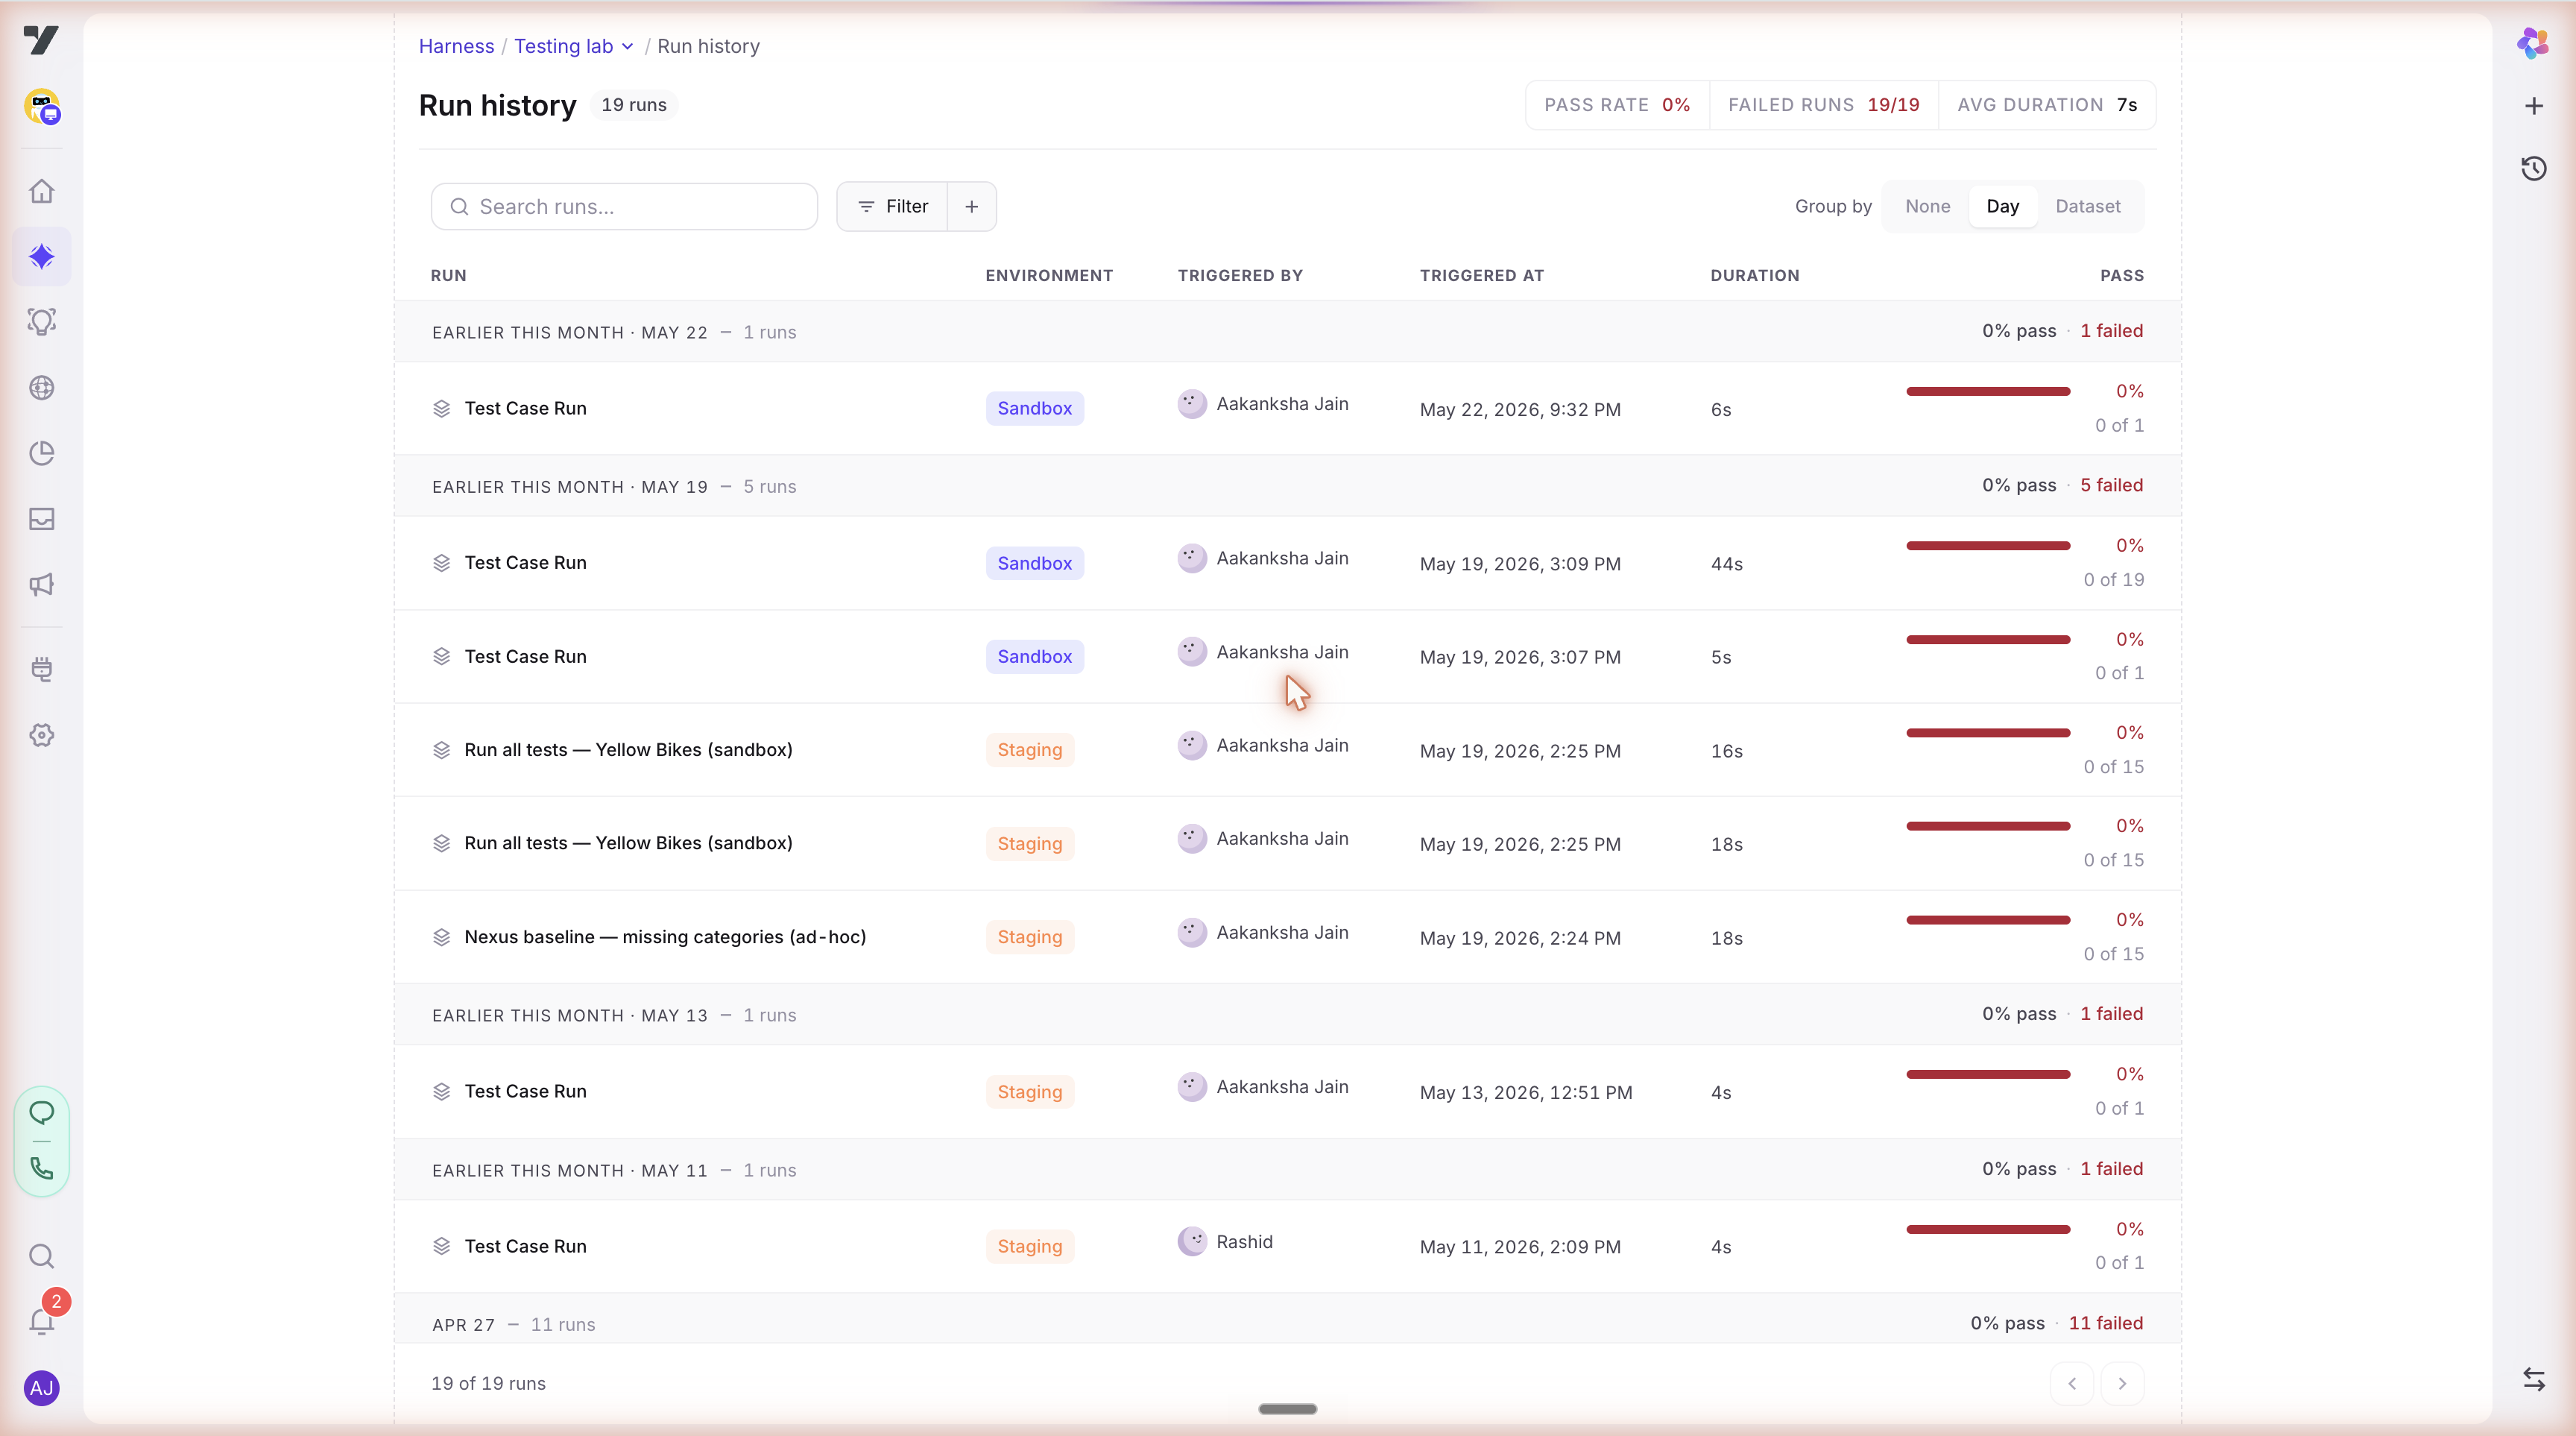
Open from AI Trust Centre → Reports. Shows a table of every completed run:
| Column | Notes |
|---|---|
| Run name | Auto-generated from the dataset name + timestamp, editable. |
| Dataset(s) | Which dataset(s) the run executed. |
| Started at | When the run was queued. |
| Duration | End-to-end wall-clock time. |
| Pass / Fail / Total | Simulation counts. |
| Trust Score | The score persisted at run completion (with its formula version). |
| Snapshot | The bot config version this run was executed against (links to the Version History entry). |
| Status | running / completed / failed / cancelled. |
Click any row to open the Individual Report.
Individual Report
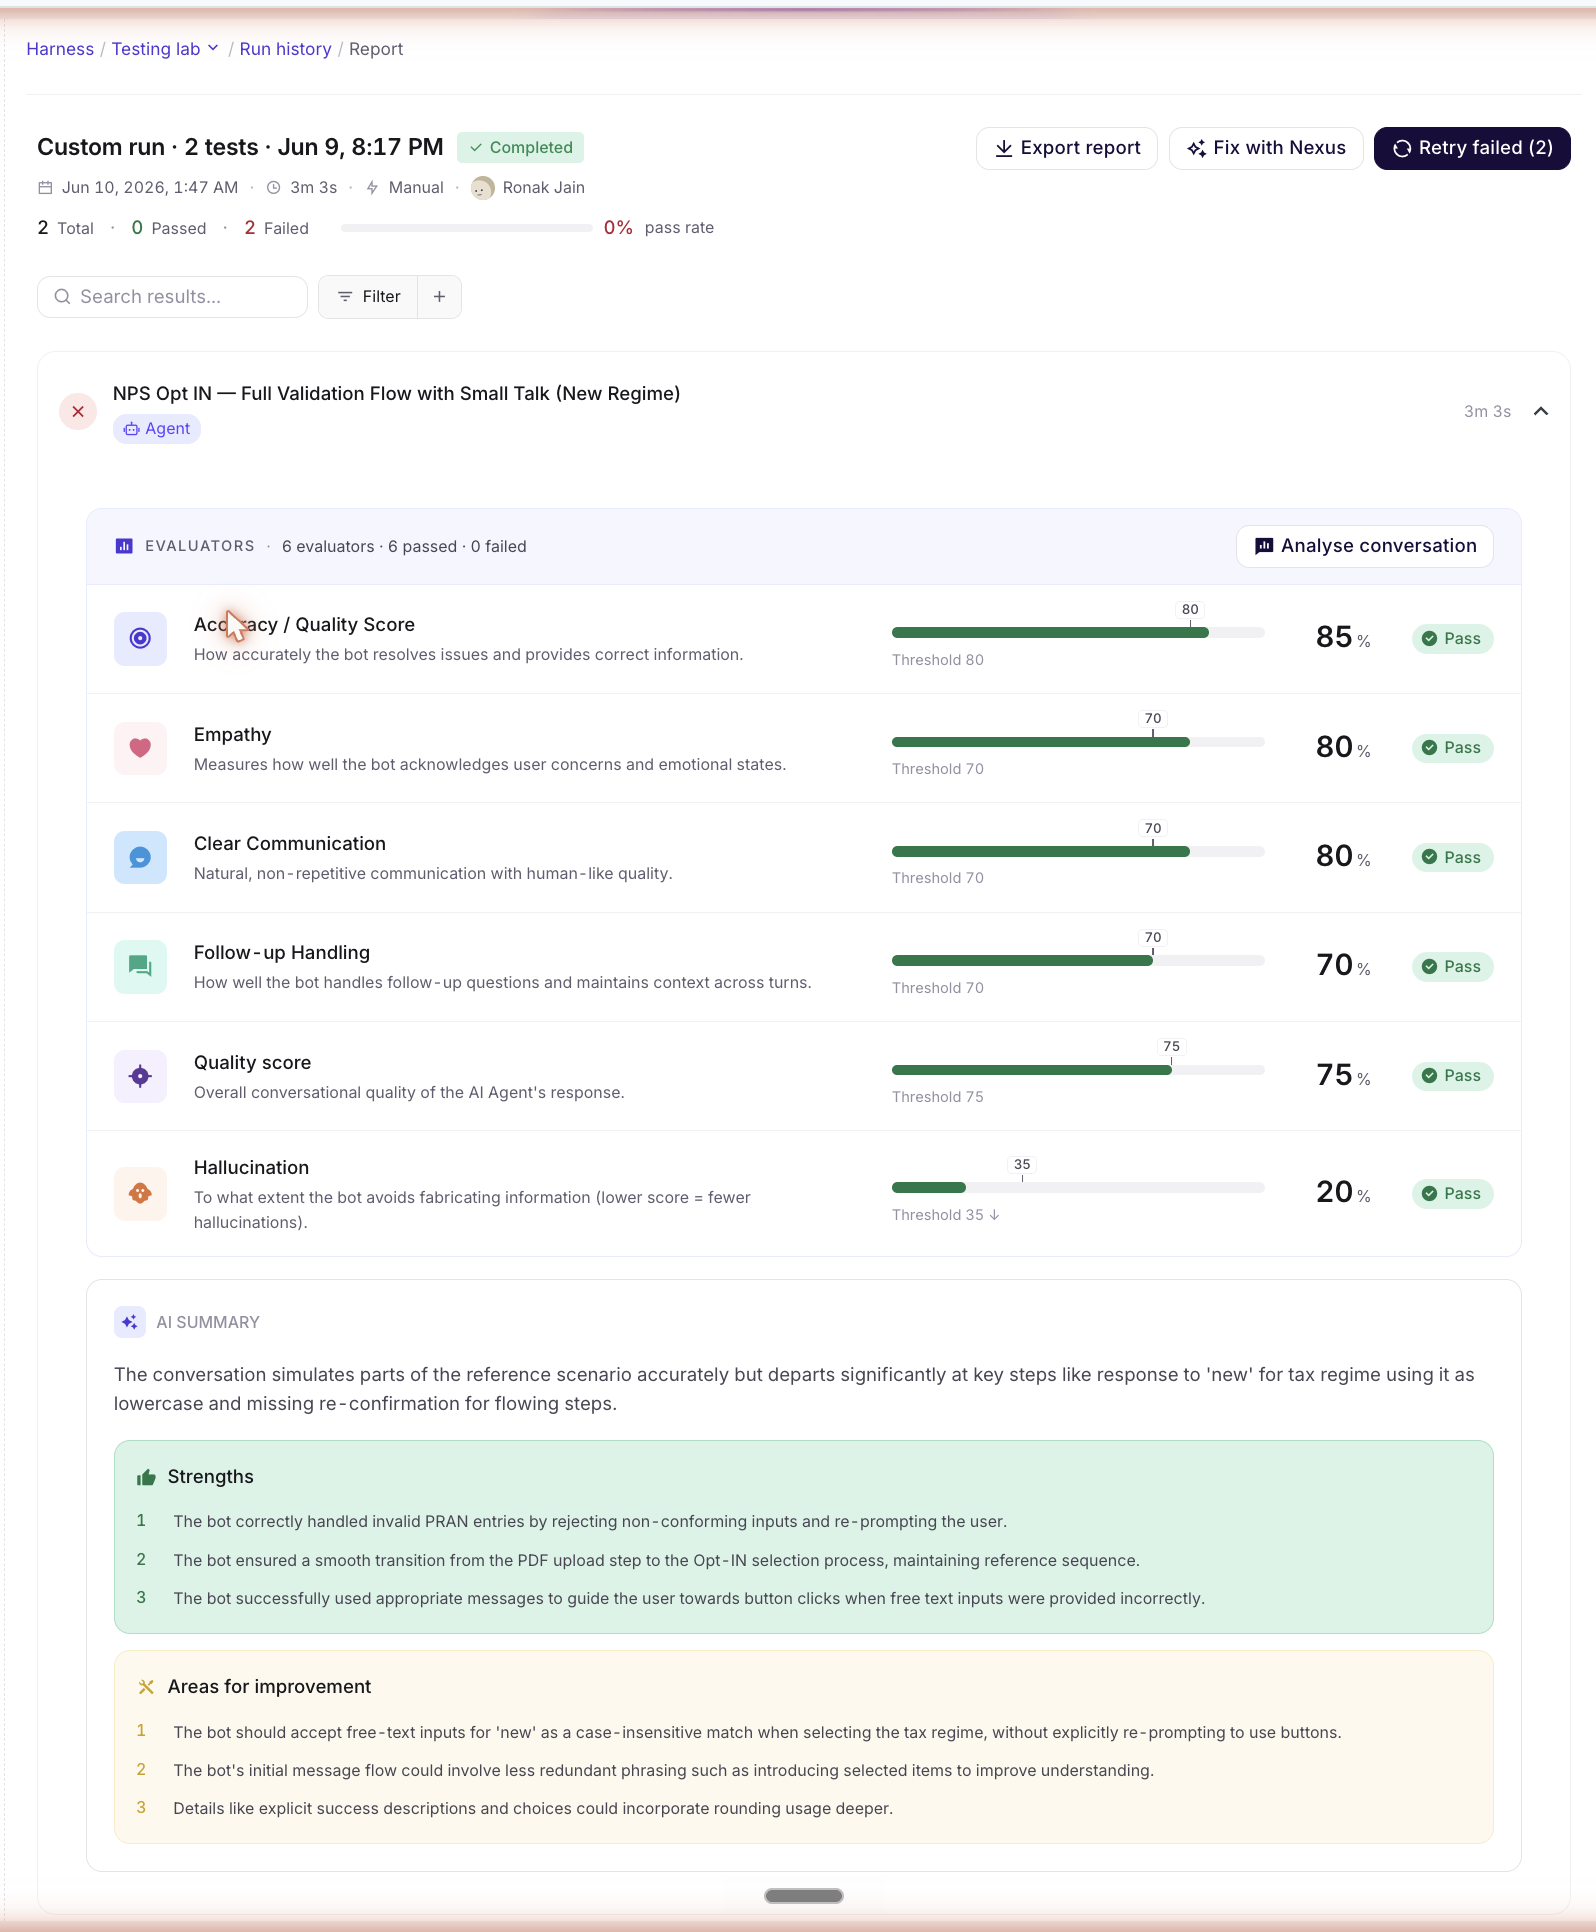
A multi-pane layout for one run:
| Pane | What's there |
|---|---|
| Sidebar | Filter by pass/fail, by agent, by evaluator-failed-most, by category. Saved filter sets. |
| Filter | The active filter chip stack — what's currently narrowing the simulation list. |
| Simulation Rules | The evaluator + rule configuration that was active when the run executed. Captured at run time so the report is stable even if Evaluators & Rules are later re-tuned. |
| Evaluation Rules | Per-evaluator threshold values used by the run. |
| Simulations | One row per test case in the run: pass/fail badge, per-evaluator scores, latency, cost, link to the Test Case detail with the run-specific trace. |
| Saved settings | Persist a filter + view configuration as a saved view (e.g. "Quality-only failures, billing agent") — handy for recurring review sessions. |
💡 Try Copilot Nexus: "Compare this run to yesterday's. Which test cases flipped from pass to fail, and what changed in the bot config between the two snapshots?"
How a Report becomes Issues
When a run completes, the issue-generation pipeline walks the simulations and clusters failures into Issues (surfaced in the Action Center when its v1 ships). The clustering today is dumb-and-predictable: (category × failureMode × component). The same failure pattern across N simulations becomes one Issue with frequency: N.
Reports never lose detail — even after failures have been rolled up into Issues, the per-simulation trace stays here under the simulation row.
Saved settings
The Saved settings modal on Individual Report lets you save a filter + sort configuration with a name. Use this when you have a recurring review session — e.g. "Friday afternoon: just look at Quality failures on the billing agent". Saved settings are per-user and live across runs (they re-apply against whatever run you open next).
Best practices
- Start from the Individual Report when investigating a regression. Reports tell you exactly what happened in a single run — the fastest way in when you're chasing a specific pass→fail flip. (Once the Action Center ships, it complements this with the longer view of what's been broken across runs.)
- Use Saved settings for recurring reviews. A team that triages once a week saves the "Critical + High failures, my agents" filter and uses it every Friday.
- Don't compare runs that used different snapshots. A pass-rate drop between runs is only attributable to bot changes when both runs share a snapshot.
- Re-run individual simulations from the row. No need to re-run the whole dataset to verify a single fix — the simulation row has a Re-run shortcut that queues just that test case.
💡 Try Copilot Nexus: "Which agents had the most regressions in this run? Group failures by agent and tell me which one to look at first."
Read next: Test Case — drill into a single case to pair its conversation with the execution trace that produced it.